DevOps for Embedded (part 3)
Intro
Note: This is the first post of the DevOps for Embedded series. Here you can find part 1 and part 2.
In this series of post, I’m explaining a different ways of creating a reusable environment for developing and also building a template firmware for an STM32F103. The project itself, meaning the STM32 firmware, doesn’t really matters and is just a reference project to work with the presented examples. Instead of this firmware you can have anything else, less or more complicated. In this post though, I’m going to use another firmware which is not the template I’ve used in the two previous posts as I want to demonstrate how a test farm can be used. More on this later.
In the first post I’ve explained how to use Packer and Ansible to create a Docker CDE (common development environment) image and use it on your host OS to build and flash your code for a simple STM32F103 project. This docker image was then pushed to the docker hub repository and then I’ve shown how you can create a gitlab-ci pipeline that triggers on repo code changes, pulls the docker CDE image and then builds the code, runs tests and finally exports the artifact to the gitlab repo.
In the second post I’ve explained how to use Packer and Ansible to build an AWS EC2 AMI image that includes the tools that you need to compile the STM32 code. Also, I’ve shown how you can install the gitlab-runner in the AMI and then use an instance of this image with gitlab-ci to build the code when you push changes in the repo. Also, you’ve seen how you can use docker and your workstation to create multiple gitlab-runners and also how to use Vagrant to make the process of running instances easier.
Therefore, we pretty much covered the CI part of the CI/CD pipeline and I’ve shown a few different ways how this can be done, so you can chose what fits your specific case.
In this post, I’ll try to scratch the surface of testing your embedded project in the CI/CD pipeline.Scratching the surface is literal, because fully automating the testing of an embedded project can be even impossible. But I’ll talk about this later.
Testing in the embedded domain
When it comes to embedded, there’s one important thing that it would be great to include in to your automation and that’s testing. There are different types of testing and a few of them apply only to the embedded domain and not in the software domain or other technology domains. That is because in an embedded project you have a custom hardware that works with a custom software and that may be connected to- or be a part of- a bigger and more complex system. So what do you test in this case? The hardware? The software? The overall system? The functionality? It can get really complicated.
Embedded projects can be also very complex themselves. Usually an embedded product consists of an MCU or application CPU and some hardware around that. The complexity is not only about the peripheral hardware around the MCU, but also the overall functionality of the hardware. Therefore, for example the hardware might be quite simple, but it might be difficult to test it because of it’s functionality and/or the testing conditions. For example, it would be rather difficult to test your toggling LED firmware on the arduino in zero-gravity or 100 g acceleration :p
Anyway, getting back to testing, it should be clear that it can become very hard to do. Nevertheless, the important thing is to know at least what you can test and what you can’t; therefore it’s mandatory to write down your specs and create a list of the tests that you would like to have and then start to group those in tests that can be done in software and those that can be done with some external hardware. Finally, you need to sort those groups on how easy is to implement each test.
You see there are many different things that actually need testing, but let’s break this down
Unit testing
Usually testing in the software domain is about running tests on specific code functions, modules or units (unit testing) and most of the times those tests are isolated, meaning that only the specific module is tested and not the whole software. Unit testing nowadays is used more and more in the lower embedded software (firmware), which is good. Most of the times though embedded engineers, especially older ones like me, don’t like unit tests. I think the reason behind that is that because it takes a lot of time to write unit tests and also because many embedded engineers are fed up with how rapid the domain is moving and can’t follow for various reasons.
There are a few things that you need to be aware of unit tests. Unit tests are not a panacea, which means is not a remedy for all the problems you may have. Unit tests only test the very specific thing you’ve programmed them to test, nothing more nothing less. Unit tests will test a function, but they won’t prevent you from using that function in a way that it will brake your code, therefore you can only test very obvious things that you already thought that they might brake your code. Of course, this is very useful but it’s far from being a solution that if you use it then you can feel safe.
Most of the times, unit tests are useful to verify that a change you’ve made in your code or in a function that is deep in the execution list of another function, doesn’t brake anything that was working before. Again, you need to have in mind that this won’t make you safe. Bad coding is always bad coding no matter how many tests you do. For example if you start pushing and popping things to the stack in your code, instead of leaving the compiler to be the only owner of the stack, then you’re heading to troubles and no unit test can save you from this.
Finally, don’t get too excited with unit testing and start to make tests for any function you have. You need to use it wisely and not spend too much time implementing tests that are not really needed. You need to reach a point that you are confident for the code you’re writing and also re-use the code you’ve written for other projects. Therefore, focus on writing better code and write tests only when is needed or for critical modules. This will also simplify your CI pipeline and make its maintenance easier.
Testing with mocks
Some tests can be done using either software or external hardware. Back in 2005 I’ve wrote the firmware for a GPS tracker and I wanted to test both the software module that was receiving and processing the NMEA GPS input via a UART and also the application firmware. To do that one way was to use a unit test to test the module, which is OK to test the processing but not much useful for real case scenario tests. The other way was to test the device out in the real world, which it would be the best option, but as you can imagine it’s a tedious and hard process to debug the device and fix code while you’re driving. Finally, the other way was to mock the GPS receiver and replay data in the UART port. This is called mocking the hardware and in this case I’ve just wrote a simple VB6 app that was replaying captured GPS NMEA data from another GPS receiver to the device under test (DUT).
There are several ways for mocking hardware. Mocking can be software only and also integrated in the test unit itself, or it can be external like the GPS tracker example. In most of the cases though, mocking is done in the unit tests without an external hardware and of course this is the simplest case and it’s preferred most of the times. I’ve used quotes in simplest, because sometimes mocking the hardware only with software integrated in the unit test can be also very hard.
Personally I consider mocking to be different from unit tests, although some times you may find them together (e.g. in a unit testing framework that supports mocking) and maybe they are presented like they are the same thing. It’s not.
In the common development environment (CDE) image that I’ve used also in the previous posts there’s another Ansible role I’ve used, which I didn’t mentioned on purpose and that’s the cpputest framework, which you’ll find in this role provisioning/roles/cpputest/tasks/main.yml. In case you haven’t read the previous posts, you’ll need to clone this repo here to run the image build examples:
https://bitbucket.org/dimtass/stm32-cde-template/src/master/
There are many testing frameworks for different programming languages, but since this example project template is limited to C/C++ I’ve used cpputest as a reference. Of course, in your case you can create another Ansible role and install the testing framework of your preference. Usually, those frameworks are easy to install and therefore also easy to add them into your image. One thing worth mention here is that if the testing framework you want to use is included in the package repository of your image (e.g. apt for debian) and you’re going to install this during the image provision, then keep in mind that this version might change if you re-build your image after some time and the package is updated in the repo, too. Of course, the same issue stands for all the repo packages.
In general, if you want to play safe you need to have this in mind. It’s not wrong to use package repositories to install tools you need during provisioning. it’s just that you need to be aware of this and that at some point one of the packages may be updated and introduce a different behavior than the expected.
System and functional testing
This is where things are getting interesting in embedded. How do you test your system? How do you test the functionality? These are the real problems in embedded and this is where you should spend most of your time when thinking about testing.
First you need to make a plan. You need to write down the specs for testing your project. This is the most important part and the embedded engineer is valuable to bring out the things that need testing (which are not obvious). The idea of compiling this list of tests needed is simple and there are two questions that you have to answer, which is what and how. What do you need to test? How are you going to do that in a simple way?
After you make this list, then there are already several tools and frameworks that can help you on doing this, so let’s have a look.
Other testing frameworks
Oh boy… this is the part that I will try to be fair and distant my self from my personal experiences and beliefs. Just a brief story, I’ve evaluated many different testing frameworks and I’m not really satisfied about what’s available out there, as everything seems too complicated or bloated or it doesn’t make sense to me. Anyway, I’ll try not to rant about that a lot, but every time in the end I had to either implement my own framework or part of it to make the job done.
The problem with all these frameworks in general is that they try to be very generic and do many things at the same time. Thus sometimes this becomes a problem, especially in cases you need to solve specific problems that could be solved easily with a bash script and eventually you spend more time trying to fit the framework in to your case, rather have a simple and clean solution. The result many times will be a really ugly hack of the framework usage, which is hard to maintain especially if you haven’t done it yourself and nobody has documented it.
When I refer to testing frameworks in this section I don’t mean unit testing frameworks, but higher level automation frameworks like Robot Framework, LAVA, Fuego Test System, tbot and several others. Please, keep in mind that I don’t mean to be disrespectful to any of those frameworks or their users and mostly their developers. These are great tools and they’ve being developed from people that know well what testing is all about (well they know better than be, tbh). I’m also sure that these frameworks fit excellent in many cases and are valuable tools to use. Personally, I prefer simplicity and I prefer simple tools that do a single thing and don’t have many dependencies, that’s it; nothing more, nothing less.
As you can see, there are a lot of testing frameworks (many more that the ones I’ve listed). Many companies or developers also make their own testing tools. It’s very important for the developer/architect of the testing to feel comfortable and connected with the testing framework. This is why testing frameworks are important and that’s why there are so many.
In this post I’ll use robot framework, only because I’ve seen many QAs are using it for their tests. Personally I find this framework really hard to maintain and I wouldn’t use it my self, because many times it doesn’t make sense and especially for embedded. Generally I think robot-framework target the web development and when it gets to integrate it in other domains it can get nasty, because of the syntax and that the delimiters are multiple spaces and also by default all variables are strings. Also sometimes it’s hard to use when you load library classes that have integer parameters and you need to pass those from the command line. Anyway, the current newer version 3.1.x handles that a bit better, but until now it was cumbersome.
Testing stages order and/or parallelization
The testing frameworks that I’ve mentioned above are the ones that are commonly used in the CI/CD pipelines. In some CI tools, like gitlab-ci, you’re able to run multiple tasks in a stage, so in case of the testing stage you may run multiple testing tasks. These tasks may be anything, e.g. unit or functional tests or whatever you want, but it is important to decide the architecture you’re going to use and if that makes sense for your pipeline. Also be aware that you can’t run multiple tasks in the same stage if those tasks are using both the same hardware, unless you handle this explicitly. For example, you can’t have two tasks sending I2C commands to the target and expect that you get valid results. Therefore, in the test stage you may run multiple tasks with unit tests and only one that accesses the target hardware (that depends on the case, of course, but you get the point).
Also let’s assume that you have unit tests and functional tests that you need to run. There’s a question that you need to ask yourself. Does it make sense to run functional tests before unit tests? Does it make sense to run them in parallel? Probably you’ll think that it’s quite inefficient to run complex and time consuming functional tests if your unit tests fails. Probably your unit tests need less time to run, so why not run them first and then run the functional tests? Also, if you run them in parallel then if your unit test fails fast, then your functional test may take a lot of time until it completes, which means that your gitlab-runner (or Jenkins node e.t.c.) will be occupied running a test on an already failed build.
On the other hand, you may prefer to run them in parallel even if one of them fails, so at least you know early that the other tests passes and you don’t have to do also changes there. But this also means that in the next iteration if you your error is not fixed, then you’ll loose the same amount of time again. Also by running the tasks parallel even if one occasionally fails and you have a many successful builds then you save a lot of time in long term. But at the same time, parallel stages means more runners, but also at the same time each runner can be specific for each task, so you have another runner to build the code and another to run functional tests. The last means that your builders may be x86_64 machines that use x86_64 toolchains and the functional test runners are ARM SBCs that don’t need to have toolchains to build code.
You see how quickly this escalates and it gets even deeper than that. Therefore, there are many details that you need to consider. To make it worse, of course, you don’t need to decide this or the other, but implement a hybrid solution or change your solution in the middle of your project because it makes more sense to have another architecture when the project starts, when is half-way and when it’s done and only updates and maintenance is done.
DevOps is (and should be) an alive, flexible and dynamic process in embedded. You need to take advantage of this flexibility and use it in a way that makes more sense in each step of your project. You don’t have to stick to an architecture that worked fine in the beginning of the project, but later it became inefficient. DevOps need to be adaptive and this is why being as much as IaC as possible makes those transitions safer and with lower risk. If your infrastructure is in code and automated then you can bring it back if an architectural core change fails.
Well, for now if you need to keep a very draft information out of this, then just try to keep your CI pipeline stages stack up in a logical way that makes sense.
Project example setup
For this post I’ll create a small farm with test servers that will operate on the connected devices under test (DUT). It’s important to make clear at this point that there many different architectures that you can implement for this scenario, but I will try to cover only two of them. This doesn’t mean that this is the only way to implement your farm, but I think having two examples to show the different ways that you can do this demonstrates the flexibility and may trigger you to find other architectures that are better for your project.
As in the previous posts I’ll use gitlab-ci to run CI/CD pipelines, therefore I’ll refer to the agents as runners. If it was Jenkins I would refer to them as nodes. Anyway, agents and runners will be used interchangeably. The same goes for stages and jobs when talking about pipelines.
A simple test server
Before getting into the CI/CD part let’s see what a test server is. The test server is a hardware platform that is able to conduct tests on the DUT (device under test) and also prepare the DUT for those tests. That preparation needs to be done in a way that the DUT is not affected from any previous tests that ran on it. That can be achieved in different ways depending the DUT, but in this case the reset state is when the firmware is flashed, the device is reset and any peripheral connections have always the same and predefined state.
For this post the DUT is the STM32F103C8T6 (blue-pill) but what should we use as a test server? The short answer is any Linux capable SBC, but in this case I’ll use the Nanopi K1 Plus and the Nanopi Neo2-LTS. Although those are different SBCs, they share the same important component, which is the Allwinner H5 SoC that integrates an ARM Cortex-A53 cpu. The main difference is the CPU clock and the RAM size, which is 2GB for the TK1 and 512MB for the Neo2. The reason I’ve chosen different SBCs is to also benchmark their differences. The cost of the Neo2 is $20 at the time the post is written and the K1 is $35. The price might be almost twice more for the K1, but $35 on the other hand is really cheap for building a farm. You could also use a rapberry pi instead, but later on it will be more obvious why I’ve chosen those SBCs.
By choosing a Linux capable SBC like these comes with great flexibility. First you don’t need to build your own hardware, which is fine for most of the cases you’ll have to deal with. If your projects demands, for some reason, a specific hardware then you may build only the part is needed in a PCB which is connected to the SBC. The flexibility then expands also to the OS that is running on the SBC, which is Linux. Having Linux running on your test server board is great for many reasons that I won’t go into detail, but the most important is that you can choose from a variety of already existing software and frameworks for Linux.
So, what packages does this test server needs to have? Well, that’s up to you and your project specs, but in this case I’ll use Python3, the robot testing framework Docker and a few other tools. It’s important to just grasp how this is set up and not which tools are used, because tools are only important to a specific project. but you can use whatever you like. During the next post I’ll explain how those tools are used in each case.
This is a simple diagram of how the test server is connected on the DUT.
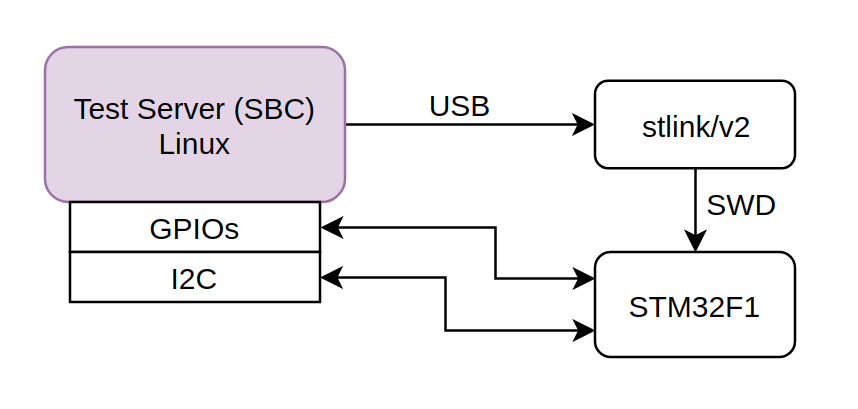
The test server (SBC) has various I/Os and ports, like USB, I2C, SPI, GPIOs, OTG e.t.c. The DUT (STM32) is connected on the ST-Link programmer via the SWD interface and the ST-Link is conencted via USB to the SBC. Also the STM32F1 is connected to the SBC via an I2C interface and a GPIO (GPIO A0)
Since this setup is meant to be simple and just a proof of concept, it doesn’t need to implement any complicated task, since you can scale this example in whatever extent you need/want to. Therefore, for this example project the STM32 device will implement a naive I2C GPIO expander device. The device will have 8 GPIOs and a set of registers that can be accessed via I2C to program each GPIO functionality. Therefore, the test server will run a robot test that will check that the device is connected and then configure a pin as output, set it high, read and verify the pin, then set it low and again read and verify the pin. Each of this tasks is a different test and if all tests pass then the testing will be successful.
So, this is our simple example. Although it’s simple, it’s important to focus on the architecture and the procedure and not in the complexity of the system. Your project’s complexity may be much more, but in the end if you break things down everything ends up to this simple case, therefore it’s many simple cases connected together. Of course, there’s a chance that your DUT can’t be 100% tested automatically for various reasons, but even if you can automate the 40-50% it’s a huge gain in time and cost.
Now let’s see the two different test farm architectures we’re going to test in this post.
Multi-agent pipeline
In multi-agent pipelines you just have multiple runners in the same pipeline. The agents may execute different actions in parallel in the same stage/job or each agent may execute a different job in the pipeline sequence, one after another. Before going to the pros and cons of this architecture, let’s see first how this is realized in our simple example.
Although the above may seem a bit complicate, in reality it’s quite simple. This shows that when a new code commit is done then the gitlab-ci will start executing the pipeline. In this pipeline there’s a build stage that is compiling the code and runs units tests on an AWS EC2 instance and if everything goes well, then the artifact (firmware binary) is uploaded to gitlab. In this case, it doesn’t really matter if it’s an AWS or any other baremetal server or whatever infrastructure you have for building code. What matters is that the code build process is done on a different agent than the one that tests the DUT.
It’s quite obvious that when it comes to the next stage, which is the automated firmware testing, that includes flashing the firmware and run tests on the real hardware, then this can’t be done on an AWS EC2 instance. It also can’t be done on your baremetal build servers which may be anywhere in your building. Therefore, in this stage you need to have another agent that will handle the testing and that means that you can have a multi-stage/multi-agent pipeline. In this case the roles are very distinct and also the test farm can be somewhere remotely.
Now let’s see some pros and cons of this architecture.
Pros:
- Isolation. Since the build servers are isolated they can be re-used for other tasks while the pipeline waits for the next stage which is the testing and which may get quite some time.
- Flexibility. If you use orchestration (e.g. kubernetes) then you can scale your build servers on demand. The same doesn’t stand for the test server though.
- Failure handling. If you use a monitoring tool or an orchestrator (e.g. Kubernetes) then if your build server fails then a new one is spawned and you’re back and running automatically.
- Maintenance. This is actually can be both in the pro and con, but in this context it means that you maintain your build servers and test servers differently and that for some is consider better. My cup is half full on this, I think it depends on the use case.
- Speed. The build servers can be much faster that the test servers, which means that the build stage will end much faster and the runners will be available for other jobs.
Cons:
- Maintenance. You’ll need to maintain two different infrastructures, which is the build servers and the test servers.
- Costs. It cost more to run both infrastructure at the same time, but the costs may be negligible in real use scenarios, especially for companies.
- Different technologies. This is quite similar with the maintenance, but also means that you need to be able to integrate all those technologies to your pipeline, which might be a pain for small teams that there’s no know-how and time to learn to do this properly. If this is not done properly in an early stage then you may deal with a lot of problems later in the development and you may even need to re-structure your solution, which means more time and maybe more money.
These are not the only pros and cons, but these are generic and there are others depending your specific project. Nevertheless, if the multi-agent pipeline architecture is clear then you can pretty much extract the pain point you may have in your specific case.
Single-agent pipeline
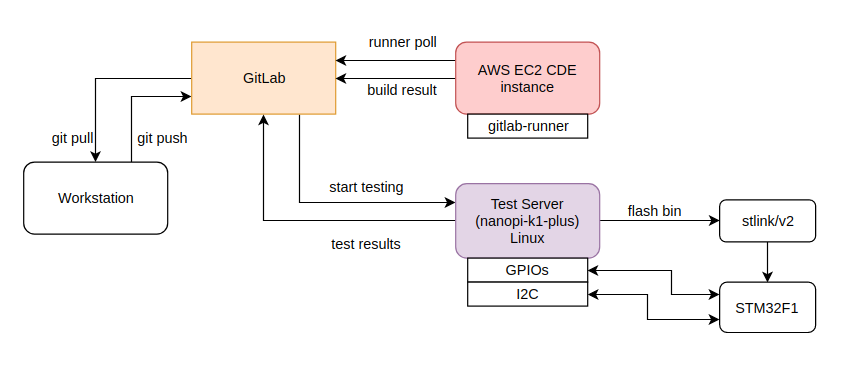
In the single-agent pipeline there’s only one runner that does everything. The runner will compile the firmware and then will also execute the tests. So the SBC will run the gitlab-runner agent, will have an ARM toolchain for the SoC architecture and will run all the needed tools, like Docker, robot tests or any other testing framework is used. This sounds awesome, right? And it actually is. To visualize this setup see the following image.

In the above image you can see that the test-server (in this case the nanopi-k1-plus) is running the the gitlab-runner client and then it peaks the build job from the gitlab-ci on a new commit. Then it uploads the firmware artifact and then it runs the tests on the target. For this to happen it means that the test server needs to have all the tools are needed and the STM32 toolchain (for the aarch64 architecture). Let’s see the pros and cons here:
Pros:
- Maintenance. Only one infrastructure to maintain.
- Cost. The running costs may be less when using this architecture.
Cons:
- Failures. If your agent fails for any reason, hardware or software, then you may need physical presence to fix this and the fix might be as simple as reset the board or change a cable or in worst case your SBC is dead and you need to replace it. Of course, this may happen in the previous architecture, but in this case you didn’t only lost a test server but also a builder.
- Speed. A Cortex-A53 is slower when building software than an x86 CPU (even if that’s a vCPU on a cloud cluster)
- Support. Currently there are a few aarch64 builds for gitlab, but gitlab is not officially supported for this architecture. This can be true also for other tools and packages, therefore you need to consider this before choosing your platform.
Again these are the generic pros/cons and in no way the only ones. There may be more in your specific case, which you need to consider by extracting your project’s pain points.
So, the next question is how do we setup our test servers?
Test server OS image
There are two ways to setup your testing farm as a IaC. I’ll only explain briefly the first one, but I’ll use the second way to this post example. The first way is to use an already existing OS image for your SBC like a debian or ubuntu distro (e.g. Armbian) and then use a provisioner like Ansible to setup the image. Therefore, you only need to flash the image to the SD card and then boot the board and then provision the OS. Let’s see the pros and cons of this solution:
Pros:
- The image is coming with an APT repository that you can use to install whatever you need using Ansible. This makes the image dynamic.
- You can update your provisioning scripts at a later point and run them on all agents.
- The provisioning scripts are versioned with git.
- The provision scripts can be re-used on any targeted hardware as long as the OS distro is the same.
Cons:
- You may need to safely backup the base OS Image as it might be difficult to find it again in the future and the provisioning may fail because of that.
- The image is bloated with unnecessary packages.
- In most of those images you need first to do the initial installation steps manually as they have a loader that expects from the user to manually create a new user for safety reasons (e.g. Armbian)
- Not being a static image may become problem in some cases as someone may install packages that make the image unstable or create a different environment from the rest agents.
- You need different images if you have different SBCs in your farm.
The strong argument to use this solution is the existence of an APT repository which is comes from a well established distro (e.g. Debian). Therefore, in this scenario you would have to download or build your base image with a cross-toolchain, which is not that hard nowadays as there are many tools for that. Then you would need to store this base image for future use. Then flash an SD card for each agent and boot the agent while is connected to the network. Then run the ansible playbook targeting your test-farm (which means you need a host file that describes your farm). After that you’re ready to go.
The second option, which I’ll actually use in the post is to build a custom OS distro using Yocto. That means that your IaC is a meta layer that builds upon a Yocto BSP layer and using the default Poky distro as a base. One of the pros for me in this case (which is not necessarily also your case), is that I’m the maintainer of this allwinner BSP layer for this SoCs… Anyway, let’s see the generic pros and cons of this option:
Pros:
- The test server specific meta layer can support all the Yocto BSPs. It doesn’t matter if you have an RPi or any of the supported allwinner BSPs, the image that you’ll get in the end will be the same.
- It’s a static image. That means all the versions will be always the same and it’s more difficult to break your environment.
- It’s an IaC solution, since it’s a Yocto meta layer which it can be hosted in a git repo.
- It’s full flexible and you can customize your image during build without the need of provisioning.
- Full control on your package repository, if you need one.
- You can still use Ansible to provision your image even if you don’t use a package repo (of course you can also build your own package repository using Yocto, which is very simple to do).
- Yocto meta layers are re-usable
Cons:
- Although you can build your own package repository and build ipk, deb and rpm packages for your image, it’s not something that it comes that easy like using Debian APT and you need to support this infrastructure also in the future. This of course gives you more control, which is a good thing.
- If you don’t use a package manager, then you can’t provision your test farm to add new functionality and you need to add this functionality to your Yocto image and then build and re-flash all the test servers. Normally, this won’t happen often, but in case you want to play safe then you need to build your own package repository.
- Yocto is much more harder to use and build your image compared to just use Ansible on a standard mainstream image.
As I’ve already mentioned in this test farm example I’ll use Yocto. You may think that for this example that’s too much, but I believe that it’s a much better solution in the long term, it’s a more proper IaC as everything is code and no binary images or external dependencies are needed. It’s also a good starting point to integrate Yocto to your workflow as it has become the industry standard and that’s for good reason. Therefore, integrating this technology to your infrastructure is not beneficial for the project workflow and also for your general infrastructure as it provides flexibility, integrates wide used and well established technologies and expands you knowledge base.
Of course, you need to always consider if the above are fit to your case if you’re working in an organisation. I mean, there’s no point to integrate a new stack in your workflow if you can do your job in a more simple way and you’re sure that you’ll never need this new stack to the current project’s workflow (or any near future project). Always, choose the more simple solution that makes you sure that fits your skills and project’s requirements; because this will bring less problems in the future and prevent you from using a new acquired skill or tool in a wrong way. But if you see or feel that the solutions that you can provide now can’t scale well then it’s probably better to spend some time to integrate a new technology rather try to fix your problems with ugly hacks that may break easily in the future (and probably they will).
Setting up the SBCs (nanopi-neo2 and nanopi-k1-plus)
The first component of the test farm is the test server. In this case I’ll use two different allwinner SBCs for that in order to show how flexible you can be by using the IaC concept in DevOps. To do that I’ll build a custom Linux image using Yocto and the result will be two identical images but for different SBCs, which you can image how powerful that is as you have full control over the image and also you can use almost any SBC.
To build the image you’ll need the meta-allwinner-hx layer which is the SBC layer that supports all those different SBCs. Since I’m the maintainer of the layer I’m updating this quite often and I try to ensure that it works properly, although I can’t test it on all the supported SBCs. Anyway, then you need an extra layer that will sit on top of the BSP and create an image with all the tools are needed and will provide a pre-configured image to support the external connected hardware (e.g. stlink) and also the required services and environment for the tests. The source of the custom test server Yocto meta layer that I’m going to use is here:
https://bitbucket.org/dimtass/meta-test-server/src/master/
In the README.md file of this repo there are instructions on how to use this layer, but I’ll also explain how to build the image here. First you need to prepare the build environment for that you need to create a folder for the image build and a folder for the sources.
1
2
3
4
mkdir -p yocto-testserver/sources
cd yocto-testserver/sources
git clone --depth 1 https://dimtass@bitbucket.org/dimtass/meta-test-server.git
cd ../
The last command will git clone the test server meta layer repo in the sources/meta-test-server folder. Now you have two options, first is to just run this script from the root folder.
1
./sources/meta-test-server/scipts/setup-project.sh
This script will prepare everything and will also build the Docker image that is needed to build the Yocto image. That means that the Yocto image for the BSP will not use your host environment, but it’s going to be built inside a Docker container. This is pretty much the same that we did in the previous posts to build the STM32 firmware, but this time we build a custom Linux distribution for the test servers.
The other option to build the image (without the script) is to type each command in the script yourself to your terminal, so you can edit any commands if you like (e.g. the docker image and container name).
Assuming that you’ve built the Docker image and now you’re in the running container, you can run these commands to setup the build environment and the then build the image:
1
2
DISTRO=allwinner-distro-console MACHINE=nanopi-k1-plus source ./setup-environment.sh build
bitbake test-server-image
After this is finished then exit the running container and you can now flash the image to the SD card and check if the test server boots. To flash the image, then you need first to find the path of your SD card (e.g. /dev/sdX) and then run this command:
1
sudo MACHINE=nanopi-k1-plus ./flash_sd.sh /dev/sdX
If this commands fails because you’re missing the bmap-tool then you can install it in your host using apt
1
sudo apt install bmap-tools
After you flash the SD card and boot the SBC (in this case the nanopi-k1-plus) with that image then you can just log in as root without any password. To do this you need to connect a USB to uart module and map the proper Tx, Rx and GND pins between the USB module and the SBC. Then you can open any serial terminal (for Linux serial terminal I prefer using putty) and connect at 115200 baudrate. Then you should be able to view the the boot messsages and login as root without password.
Now for sanity check you can run the uname -a command. This is what I get in my case (you’ll get a different output while the post is getting older).
1
2
root:~# uname -a
Linux nanopi-k1-plus 5.3.13-allwinner #1 SMP Mon Dec 16 20:21:03 UTC 2019 aarch64 GNU/Linux
That means that the Yocto image runs on the 5.3.13 SMP kernel and the architecture is aarch64. You can also test that docker, gitlab-runner and the toolchain are there. For example you can just git clone the STM32 template code I’ve used in the previous posts and build the code. If that builds then you’re good to go. In my case, I’ve used these commands here in the nanopi-k1-plus:
1
2
3
git clone --recursive https://github.com/dimtass/stm32f103-cmake-template.git
cd stm32f103-cmake-template
time TOOLCHAIN_DIR=/opt/toolchains/gcc-arm-none-eabi-9-2019-q4-major CLEANBUILD=true USE_STDPERIPH_DRIVER=ON SRC=src_stdperiph ./build.sh
And this is the result I got:
1
2
3
4
5
6
7
8
9
10
11
12
13
14
15
16
17
18
19
20
21
Building the project in Linux environment
- removing build directory: /home/root/stm32f103-cmake-template/build-stm32
--- Pre-cmake ---
architecture      : stm32
distclean         : true
parallel          : 4
...
[ 95%] Linking C executable stm32-cmake-template.elf
   text	   data	    bss	    dec	    hex	filename
  14924	    856	   1144	  16924	   421c	stm32-cmake-template.elf
[ 95%] Built target stm32-cmake-template.elf
Scanning dependencies of target stm32-cmake-template.hex
Scanning dependencies of target stm32-cmake-template.bin
[100%] Generating stm32-cmake-template.hex
[100%] Generating stm32-cmake-template.bin
[100%] Built target stm32-cmake-template.hex
[100%] Built target stm32-cmake-template.bin

real	0m11.816s
user	0m30.953s
sys	0m3.973s
That means that the nanopi-k1-plus built the STM32 template firmware using 4 threads and the aarch64 GCC toolchain and this tool 11.8 secs. Yep, you see right. The nanopi with the 4-core ARM-CortexA53 is by far the slowest when it comes to build the firmware even compared to AWS EC2. Do you really care about this though? Maybe not, maybe yes. Anyway I’ll post the benchmark results later in this post.
Next test is to check if the SBC is able to flash the firmware on the STM32. First you can probe the st-link. In my case this is what I get:
1
2
3
4
5
6
7
8
root:~/stm32f103-cmake-template# st-info --probe
Found 1 stlink programmers
 serial: 513f6e06493f55564009213f
openocd: "\x51\x3f\x6e\x06\x49\x3f\x55\x56\x40\x09\x21\x3f"
  flash: 65536 (pagesize: 1024)
   sram: 20480
 chipid: 0x0410
  descr: F1 Medium-density device
Therefore, that means that the st-link is properly built, installed and the udev rules work fine. Next step is to try to flash the firmware with this command:
1
st-flash --reset write build-stm32/src_stdperiph/stm32-cmake-template.bin 0x8000000
Then you should see something like this in the terminal
1
2
3
4
5
6
7
8
9
10
11
12
st-flash 1.5.1
2019-12-20T23:56:22 INFO common.c: Loading device parameters....
2019-12-20T23:56:22 INFO common.c: Device connected is: F1 Medium-density device, id 0x20036410
2019-12-20T23:56:22 INFO common.c: SRAM size: 0x5000 bytes (20 KiB), Flash: 0x10000 bytes (64 KiB) in pages of 1024 bytes
2019-12-20T23:56:22 INFO common.c: Attempting to write 15780 (0x3da4) bytes to stm32 address: 134217728 (0x8000000)
Flash page at addr: 0x08003c00 erased
2019-12-20T23:56:24 INFO common.c: Finished erasing 16 pages of 1024 (0x400) bytes
2019-12-20T23:56:24 INFO common.c: Starting Flash write for VL/F0/F3/F1_XL core id
2019-12-20T23:56:24 INFO flash_loader.c: Successfully loaded flash loader in sram
 16/16 pages written
2019-12-20T23:56:25 INFO common.c: Starting verification of write complete
2019-12-20T23:56:25 INFO common.c: Flash written and verified! jolly good!
That means that the SBC managed to flash the firmware on the STM32. You can visually verify this by checking that the LED on gpio C13 is toggling every 500ms.
Great. By doing those steps we verified that we’ve built a Docker image that can build the Yocto image for the nanopi-k1-plus and after booting the image all the tools that are needed to build and flash the STM32 firmware are there and work fine.
The above sequence can be integrated in a CI pipeline that builds the image whenever there’s a change in the meta-test-server layer. Therefore, when you add more tools or change things in the image and push the changes then the pipeline build the new Linux image that you can flash to the SD cards of the SBCs. The MACHINE parameter in the build command can be a parameter in the pipeline so you can build different images for any SBC that you have. This makes things simple and automates your test farm infrastructure (in terms of the OS).
Note: You can also connect via ssh as root in the image without password if you know the IP. Since DHCP is on by default for the image then if you don’t want to use a USB to serial module then you can assign a static IP in your router to the SBC using its MAC address.
You may wonder here, why I’ve used a Dockerfile to build the image that builds the Yocto image, instead of using Packer and Ansible like I’ve did in the previous posts. Well, the only reason is that the Dockerfile comes already with the meta-allwinner-hx repo and it’s well tested and ready to be use. You can definitely use Packer to build your custom docker image that builds your Yocto image but is that what you really want in this case? Think that the distributed Dockerfile that comes with the meta-allwinner-hx Yocto layer is what your vendor or distributor may supply you with for another SBC. In this case it’s always better to use what you get from the vendor because you will probably get support when something goes wrong.
Therefore, don’t always create everything from the scratch, but use whatever is available that makes your life easier. DevOps is not about create everything from the scratch but use whatever is simpler for your case.
Also in this case, there’s also something else that you need to consider. Since I don’t have powerful build servers to build yocto images, I have to do it on my desktop workstation. Building a Yocto image may require more that 16GB or RAM and 50GB of disk space and also 8 cores are quite the minimum.
Also, using AWS EC2 to build a Yocto image doesn’t make sense either for this case, since this would require a very powerful EC2 instance, a lot of time and a lot of space.
So, in your specific case you’ll need a quite powerful build server if you want to integrate the Yocto image build in your CI/CD (which you should). For this post, though, I’ll use my workstation to build the image and I’ll skip the details of creating a CI/CD pipeline for build the Yocto image as it’s pretty much the same as any other CI/CD case except that you’ll need a more powerful agent.
In case you need to have the Yocto docker image in a registry, then use Packer to build those images and upload them to a docker registry or make a CI/CD pipeline that just builds the Yocto builder image from a Dockerfile (in this case the ine in the meta-allwinner-hx repo) and then uploads that image on your remote/local registry. There are many possibilities, you choose what is the best and easier for your.
Again, the specific details for this test case are not important. What’s important is the procedure and the architecture.
Setting up the DUT
Now that you’ve setup your test server it’s time to setup your DUT (the stm32f103 blue pill in this case). What’s important is how you connect the SBC and the STM32 as you need to power the STM32 and also connect the proper pins. The following table shows the connections you need to make (the pin number for nanopi-neo2 are here and for nanopi-k1-plus here).
| SBC (nanopi-neo2/k1-plus) pin # : [function] | STM32F103 (blue pill) in # |
|---|---|
| 1: [SYS_3.3V] | 3V3 |
| 3: [I2C0_SDA] | PB7 |
| 5: [I2C0_SCL] | PB6 |
| 6: [GND] | GND |
| 7: [GPIOG11] | PA0 |
The ST-LINK USB module is connected on any available USB port of your SBC (nanopi-neo2 has only one). Then you need to connect the pins of the module to the STM32. That’s straight forward just connect the RST, SWDIO, SWCLK and GND of the module to the same pins on the STM32 (the SWDIO, SWCLK and GND are in the connector on the back and only RST is near PB11). Do not connect the 3V3 power of the ST-LINK module to the STM32 as it’s already getting power from the SBC’s SYS_3.3V.
Since we’re using the I2C bus then we need to use two external pull-up resistors on the PB7 and PB6 pins. Just connect those two resistors to the pins and one of the available 3V3 pins of the STM32.
Finally, for debugging purposes you may want to connect the serial port of the SBC and the STM32 to two USB-to-UART modules. I’ve done this for debugging and generally is useful at the point you’re setting up your farm and when everything is working as expected then remove it and only re-connect when troubleshooting an agent in your farm.
As I’ve mentioned before, I won’t use the same STM32 template firmware I’ve used in the previous posts, but this time I’ll use a firmware that actually does something. The firmware code is located here:
https://gitlab.com/dimtass/stm32f103-i2c-io-expander
Although the README file contains a lot of info about the firmware, I’ll make a brief description about it. So, this firmware will make the stm32f103 to function as an I2C GPIO expander, like the ones that are used from many Linux SBCs. The mcu will be connected to the SBC via I2C and a GPIO, then the SBC will be able to configure the stm32 pins using the I2C protocol and then also control the GPIO. The protocol is quite simple and it’s explained in detail in the README.
If you want to experiment with building the firmware locally on your host or the SBC you can do it, so you get a bit familiar with the firmware, but it’s not necessary from now on as everything will be done by the CI pipeline.
Automated tests
One last thing before we get to testing the farm, is to explain what tests are in the firmware repo and how they are used. Let’s go back again in the firmware repo here:
https://gitlab.com/dimtass/stm32f103-i2c-io-expander
In this repo you’ll see a folder that is named tests. In there you’ll find all the test scripts that the CI pipeline will use. The pipeline configuration yaml file is on the root folder of the repo and it’s named .gitlab-ci.yml as the previous posts. In this file you’ll see that there are 3 stages which are the build, flash and test. The build stage will build the code, the flash stage will flash the binary on the STM32 and finally the test stage will run a test using the robot-framework. Although, I’m using robot-framework here, that could be any other framework or even scripts.
The robot test is the tests/robot-tests/stm32-fw-test.robot file. If you open this file you’ll see that it uses two Libraries. Those libraries are just python classes that are located in tests/ and specifically it’s calling tests/STM32GpioExpander.py and tests/HostGpio.py. Those files are just python classes, so open those files and have a look in there, too.
The tests/STM32GpioExpander.py implements the I2C specific protocol that the STM32 firmware supports to configure the GPIOs. This class is using the python smbus package which is installed from the meta-test-server Yocto layer. You also see that this object supports to probe the I2C to find if there’s an STM32 device running the firmware. This is done by reading the 0x00 and 0x01 registers that contain the magic word 0xBEEF (sorry no vegan hex). Therefore this function will read those two registers and if 0xBEEF is found then it means that the board is there and running the correct firmware. You could also add a firmware version (which you should), but I haven’t in this case. You’ll also find functions to read/write registers, set the configuration of the available GPIOs and set the pins value.
Next, the tests/HostGpio.py class exposes a python interface to configure and control the SBC’s GPIOs in this case. Have in mind that when you use the SBC’s GPIOs via the sysfs in Linux, then you need some additional udev rules in your OS for the python to have the proper permissions. This file is currently provided from the meta-allwinner-hx BSP layer in this file meta-allwinner-hx/recipes-extended/udev/udev-python-gpio/60-python-gpio-permissions.rules. Therefore, in case you use your own image you need to add this rule to your udev otherwise the GPIOs won’t be available with this python class.
The rest of the python files are just helpers, so the above two files are the important ones. Back to the robot test script you can see the test cases, which I list here for convenience.
1
2
3
4
5
6
7
8
9
10
11
12
13
14
15
16
17
18
19
20
21
22
23
24
25
26
27
28
*** Test Cases ***
Probe STM32
     ${probe} =     stm32.probe
     Log  STM32GpioExpander exists ${probe}

Config output pin
     ${config} =    stm32.set_config    ${0}  ${0}  ${0}  ${1}  ${0}  ${0}
     Log  Configured gpio[0] as output as GPOA PIN0

Set stm32 pin high
     ${pin} =  stm32.set_pin  ${0}  ${1}
     Log  Set gpio[0] to HIGH

Read host pin
     host.set_config     ${203}  ${0}  ${0}
     ${pin} =  host.read_pin  ${203}
     Should Be Equal     ${pin}  1
     Log  Read gpio[0] value: ${pin}

Reset stm32 pin
     ${pin} =  stm32.set_pin  ${0}  ${0}
     Log  Set gpio[0] to LOW

Read host pin 2
     host.set_config     ${203}  ${0}  ${0}
     ${pin} =  host.read_pin  ${203}
     Should Be Equal     ${pin}  0
     Log  Read gpio[0] value: ${pin}
The first test is called Probe STM32 and it just probes the STM32 device and reads the magic word (or the preamble if you prefer). This will actually call the STM32GpioExpander.probe() function which returns True if the device exists otherwise False. The next test Config output pin will configure the STM32’s output PA0 as output. The next test Set stm32 pin high will set the PA0 to HIGH. The next test Read host pin will configure the SBC’s GPIOG11 (pin #203) to input and then read if the input which is connected to the STM32 output PA0 is indeed HIGH. If the input reads 1 then the test passes. The next test Reset stm32 pin will set the PA0 to LOW (0). Finally, the last test Read host pin 2 will read again the GPIOG11 pin and verify that it’s low.
If all tests pass then it means that the firmware is flashed, the I2C bus is working, the protocol is working for both sides and the GPIOs are working properly, too.
Have in mind that the voltage levels for the SBC and the STM32 must be the same (3V3 in this case), so don’t connect a 5V device to the SBC and if you do, then you need to use a voltage level shifter IC. Also you may want to connect a 5-10KΩ resistor in series with the two pins, just in case. I didn’t but you should :p
From the .gitlab-ci.yml you can see that the robot command is the following:
1
robot --pythonpath . --outputdir ./results -v I2C_SLAVE:0x08 -v BOARD:nanopi_neo2 -t "Probe STM32" -t "Config output pin" -t "Set stm32 pin high" -t "Read host pin" -t "Reset stm32 pin" -t "Read host pin 2" ./robot-tests/
Yes, this is a long command, which passes the I2C slave address as a parameter, the board parameter and a list with the tests to run. The I2C address can be omitted as it’s hard-coded in the robot test for backwards compatibility as in pre-3.1.x versions all parameters are passed as strings and this won’t work with the STM32GpioExpander class. The robot command will only return 0 (which means no errors) if all tests are passed.
A couple of notes here. This robot test will run all tests in sequence and it will continue in the next test even if the previous fails. You may don’t like this behavior, so you can change that by calling the robot test multiple times for each test and if the previous fails then skip the rest tests. Anyway, at this point you know what’s the best scenario for you, but just have that in mind when you write your tests.
Testing the farm!
When everything is ready to go then you just need to push a change to your firmware repo or manually trigger the pipeline. At that point you have your farm up and running. This is a photo of my small testing farm.
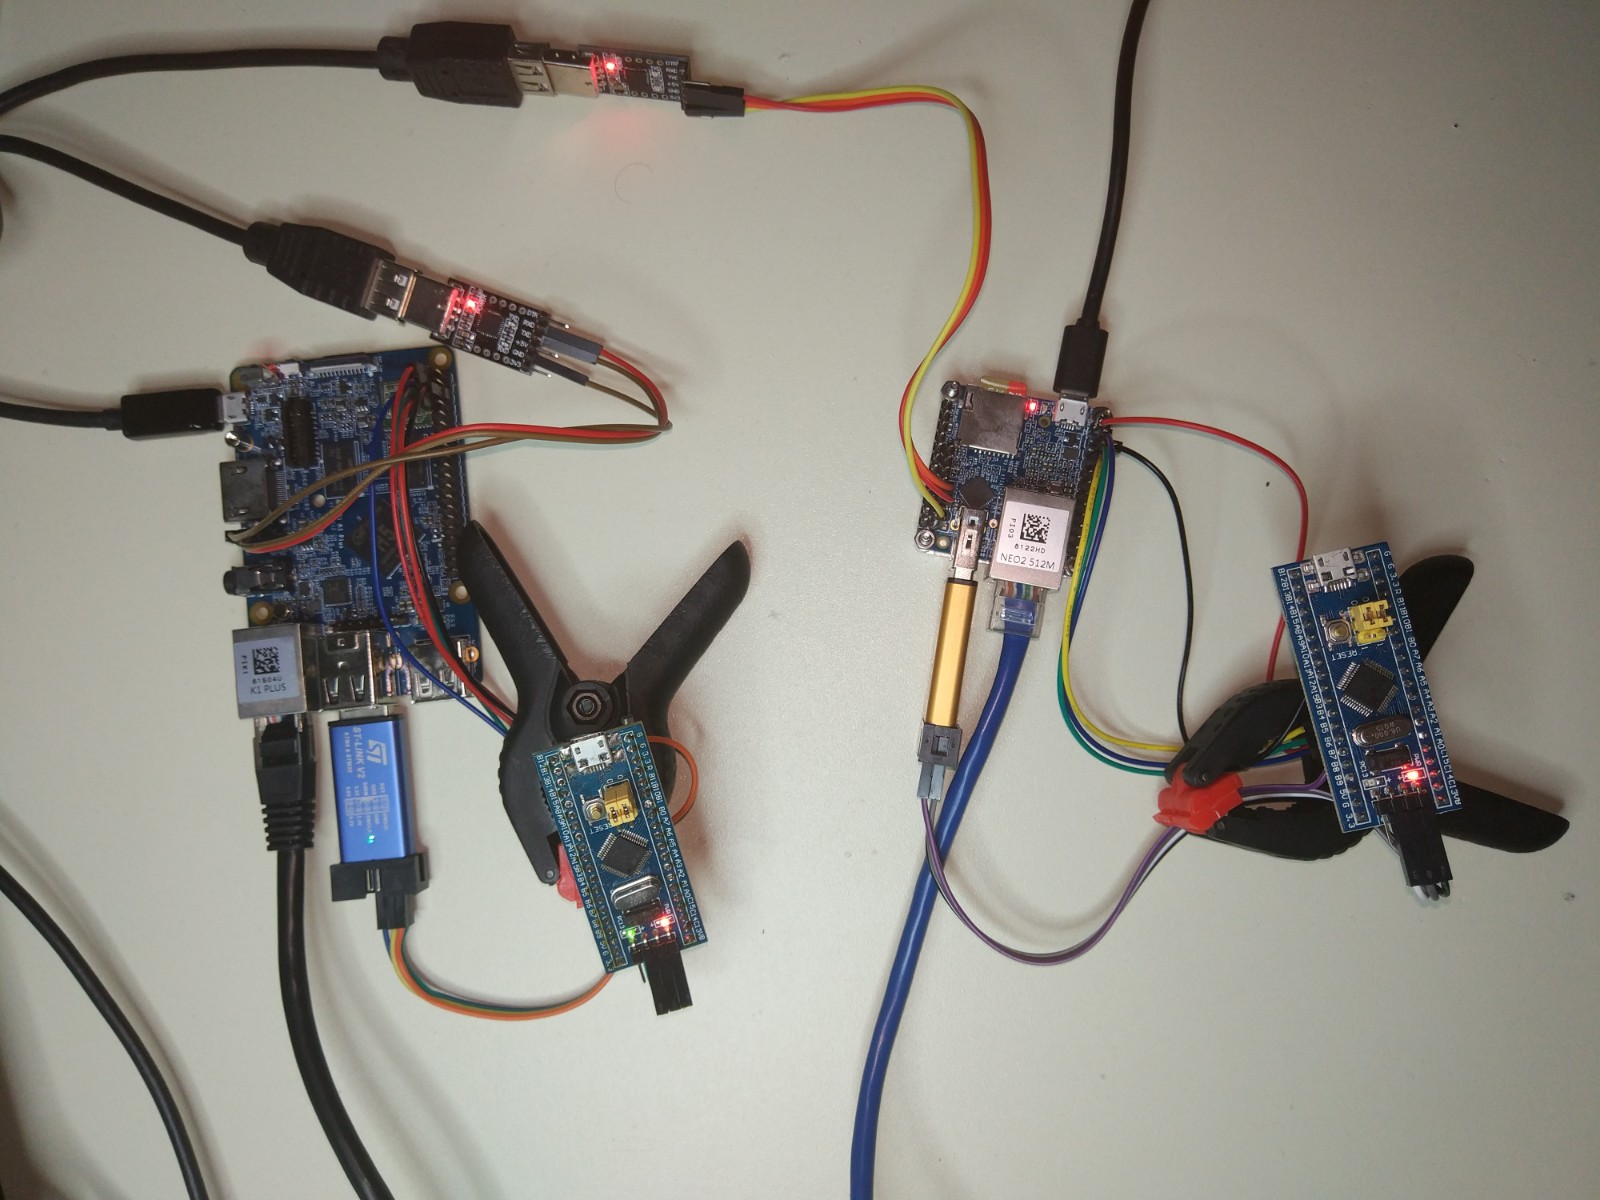
On the left side is the nanopi-k1-plus and on the right side is the nanopi-neo2. Both are running the same Yocto image, have an internet connection, have an ST-LINK v2 connected on the USB port and the I2C and GPIO signals are connected between the SBC and the STM32. Also the two UART ports of the SBCs are connected to my workstation for debugging. Although you see only two test servers in the photo you could have as many as you like in your farm.
Next step is to make sure that the gitlab-runner is running in both SBCs and they’re registered as runners in the repo. Normally in this case the gitlab-runner is a service in the Yocto image that runs a script to make sure that if the SBC is not registered then it registers automatically to the project. For this to make it happen, you need to add two lines in your local.conf file when you build the Yocto image.
1
2
GITLAB_REPO = "stm32f103-i2c-io-expander"
GITLAB_TOKEN = "4sFaXz89yJStt1hdKM9z"
Of course, you should change those values with yours. Just as a reminder, although I’ve explained in the previous post how to get those values, the GITLAB_REPO is just your repo name and the GITLAB_TOKEN is the token that you get in the Settings -> CI/CD -> Runners tab in your gitlab repo.
In case that the gitlab-runner doesn’t run in your SBC for any reason then just run this command in your SBC’s terminal
1
/usr/bin/initialize-gitlab-runner.sh
In my case everything seems to be working fine, therefore in my gitlab project I can see this in the ``Settings -> CI/CD -> Runners`.
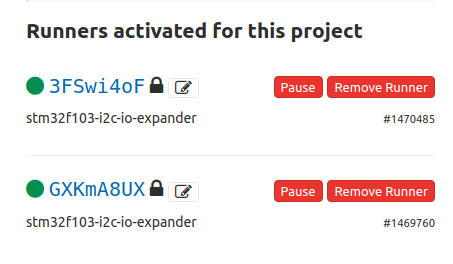
Note: You need to disable the shared runners in the Settings -> CI/CD -> Runners page for this to work, otherwise any random runner will pick the job and fail.
The first one is the nanopi-k1-plus and the second one is the nanopi-neo2. You can verify those hashes in your /etc/gitlab-runner/config.toml file in each SBC in the token parameter.
Next I’m triggering the pipeline manually and see what happens. In the gitlab web interface (after some failures until get the pipeline up and running) I see that there are 3 stages and the build stage started. The first job is picked by the nanopi-neo2 and you can see the log here. This is part of this log
1
2
3
4
5
6
7
8
9
10
11
12
13
14
15
16
17
18
19
20
21
22
23
24
25
1 Running with gitlab-runner 12.6.0~beta.2049.gc941d463 (c941d463)
2   on nanopi-neo2 _JXcYZdJ
3 Using Shell executor... 00:00
5 Running on nanopi-neo2... 00:00
7 Fetching changes with git depth set to 50... 00:03
8 Reinitialized existing Git repository in /home/root/builds/_JXcYZdJ/0/dimtass/stm32f103-i2c-io-expander/.git/
9 From https://gitlab.com/dimtass/stm32f103-i2c-io-expander
10  * [new ref]         refs/pipelines/106633593 -> refs/pipelines/106633593
...

141 [100%] Built target stm32f103-i2c-io-expander.bin
142 [100%] Built target stm32f103-i2c-io-expander.hex
143 real	0m14.413s
144 user	0m35.717s
145 sys	0m4.805s
148 Creating cache build-cache... 00:01
149 Runtime platform                                    arch=arm64 os=linux pid=4438 revision=c941d463 version=12.6.0~beta.2049.gc941d463
150 build-stm32/src: found 55 matching files
151 No URL provided, cache will be not uploaded to shared cache server. Cache will be stored only locally.
152 Created cache
154 Uploading artifacts... 00:03
155 Runtime platform                                    arch=arm64 os=linux pid=4463 revision=c941d463 version=12.6.0~beta.2049.gc941d463
156 build-stm32/src/stm32f103-i2c-io-expander.bin: found 1 matching files
157 Uploading artifacts to coordinator... ok            id=392515265 responseStatus=201 Created token=dXApM1zs
159 Job succeeded
This means that the build succeeded, it took 14.413s and the artifact is uploaded. It’s interesting also that the runtime platform is arch=arm64 because the gitlab-runner is running on the nanopi-neo2, which is an ARM 64-bit CPU.
Next stage is the flash stage and the log is here. This is a part of this log:
1
2
3
4
5
6
7
8
9
10
11
12
13
14
15
16
17
18
19
20
21
22
23
24
25
26
1 Running with gitlab-runner 12.6.0~beta.2049.gc941d463 (c941d463)
2   on nanopi-neo2 _JXcYZdJ
3 Using Shell executor... 00:00
5 Running on nanopi-neo2... 00:00
7 Fetching changes with git depth set to 50... 00:03
8 Reinitialized existing Git repository in /home/root/builds/_JXcYZdJ/0/dimtass/stm32f103-i2c-io-expander/.git/
9 Checking out bac70245 as master...
...

30 Downloading artifacts for build (392515265)... 00:01
31 Runtime platform                                    arch=arm64 os=linux pid=4730 revision=c941d463 version=12.6.0~beta.2049.gc941d463
32 Downloading artifacts from coordinator... ok        id=392515265 responseStatus=200 OK token=dXApM1zs
34 $ st-flash --reset write build-stm32/src/stm32f103-i2c-io-expander.bin 0x8000000 00:02
35 st-flash 1.5.1
36 2020-01-02T14:41:27 INFO common.c: Loading device parameters....
37 2020-01-02T14:41:27 INFO common.c: Device connected is: F1 Medium-density device, id 0x20036410
38 2020-01-02T14:41:27 INFO common.c: SRAM size: 0x5000 bytes (20 KiB), Flash: 0x10000 bytes (64 KiB) in pages of 1024 bytes
39 2020-01-02T14:41:27 INFO common.c: Attempting to write 12316 (0x301c) bytes to stm32 address: 134217728 (0x8000000)
40 Flash page at addr: 0x08003000 erased
41 2020-01-02T14:41:28 INFO common.c: Finished erasing 13 pages of 1024 (0x400) bytes
42 2020-01-02T14:41:28 INFO common.c: Starting Flash write for VL/F0/F3/F1_XL core id
43 2020-01-02T14:41:28 INFO flash_loader.c: Successfully loaded flash loader in sram
44  13/13 pages written
45 2020-01-02T14:41:29 INFO common.c: Starting verification of write complete
46 2020-01-02T14:41:29 INFO common.c: Flash written and verified! jolly good!
51 Job succeeded
Nice, right? The log shows that this stage cleaned up the previous job and downloaded the firmware artifact and the used the st-flash tool and the ST-LINKv2 to flash the binary to the STM32 and that was successful.
Finally, the last stage is the run_robot stage and the log is here. This is part of this log:
1
2
3
4
5
6
7
8
9
10
11
12
13
14
15
16
17
18
19
20
21
22
23
24
25
26
27
28
29
30
31
32
33
34
35
36
37
38
39
40
1 Running with gitlab-runner 12.6.0~beta.2049.gc941d463 (c941d463)
2   on nanopi-neo2 _JXcYZdJ
3 Using Shell executor... 00:00
5 Running on nanopi-neo2...
...

32 Downloading artifacts for build (392515265)... 00:01
33 Runtime platform                                    arch=arm64 os=linux pid=5313 revision=c941d463 version=12.6.0~beta.2049.gc941d463
34 Downloading artifacts from coordinator... ok        id=392515265 responseStatus=200 OK token=dXApM1zs
36 $ cd tests/ 00:02
37 $ robot --pythonpath . --outputdir ./results -v I2C_SLAVE:0x08 -v BOARD:nanopi_neo2 -t "Probe STM32" -t "Config output pin" -t "Set stm32 pin high" -t "Read host pin" -t "Reset stm32 pin" -t "Read host pin 2" ./robot-tests/
38 ==============================================================================
39 Robot-Tests
40 ==============================================================================
41 Robot-Tests.Stm32-Fw-Test :: This test verifies that there is an STM32 board
42 ==============================================================================
43 Probe STM32                                                           | PASS |
44 ------------------------------------------------------------------------------
45 Config output pin                                                     | PASS |
46 ------------------------------------------------------------------------------
47 Set stm32 pin high                                                    | PASS |
48 ------------------------------------------------------------------------------
49 Read host pin                                                         | PASS |
50 ------------------------------------------------------------------------------
51 Reset stm32 pin                                                       | PASS |
52 ------------------------------------------------------------------------------
53 Read host pin 2                                                       | PASS |
54 ------------------------------------------------------------------------------
55 Robot-Tests.Stm32-Fw-Test :: This test verifies that there is an S... | PASS |
56 6 critical tests, 6 passed, 0 failed
57 6 tests total, 6 passed, 0 failed
58 ==============================================================================
59 Robot-Tests                                                           | PASS |
60 6 critical tests, 6 passed, 0 failed
61 6 tests total, 6 passed, 0 failed
62 ==============================================================================
63 Output:  /home/root/builds/_JXcYZdJ/0/dimtass/stm32f103-i2c-io-expander/tests/results/output.xml
64 Log:     /home/root/builds/_JXcYZdJ/0/dimtass/stm32f103-i2c-io-expander/tests/results/log.html
65 Report:  /home/root/builds/_JXcYZdJ/0/dimtass/stm32f103-i2c-io-expander/tests/results/report.html
70 Job succeeded
Great. This log shows that robot test ran in the SBC and all the tests were successful. Therefore, because all the tests are passed I get this:

Green is the favorite color of DevOps.
Let’s make a resume of what was achieved. I’ve mentioned earlier that I’ll test two different architectures. This is the second one that the test server is also the agent that builds the firmware and then also performs the firmware flashing and testing. This is a very powerful architecture, because a single agent runs all the different stages, therefore it’s easy to add more agents without worrying about adding more builders in the cloud. On the other hand the build stage is slower and also it would be much easier to add more builders in the cloud rather adding SBCs. Of course cloud builders are only capable of building the firmware faster, therefore the bottleneck will always be the flashing and testing stages.
What you should keep from this architecture example is that everything is included in a single runner (or agent or node). There are no external dependencies and everything is running in one place. You will decide if that’s good or bad for your test farm.
Testing the farm with cloud builders
Next I’ll implement the first architecture example that I’ve mentioned earlier, which is that one:
In the above case I’ll create an AWS EC2 instance to build the firmware in the same way that I did it in the previous post here. The other two stages (flashing and testing) will be executed on the SBCs. So how do you do that?
Gitlab CI supports tags for the runners, so you can specify which stage is running on which runner. You can have multiple runners with different capabilities and each runner type can have a custom tag that defines it’s capabilities. Therefore, I’ll use a different tag for the AWS EC2 instance and the SBCs and each stage in the .gitlab-ci.yml will execute on the specified tag. This is a very powerful feature as you can have agents with different capabilities that serve multiple projects.
Since I don’t to change the default .gitlab-ci.yml pipeline in my repo I’ll post the yaml file you need to use here:
1
2
3
4
5
6
7
8
9
10
11
12
13
14
15
16
17
18
19
20
21
22
23
24
25
26
27
28
29
30
31
32
33
34
35
36
37
38
39
40
41
42
---
    image:
        name: dimtass/stm32-cde-image:0.1
        entrypoint: [""]

    variables:
        GIT_SUBMODULE_STRATEGY: recursive

    stages:
        - build
        - flash
        - test

    build:
        tags:
            - stm32-builder
        stage: build
        script: time TOOLCHAIN_DIR=/opt/toolchains/gcc-arm-none-eabi-9-2019-q4-major CLEANBUILD=true USE_STDPERIPH_DRIVER=ON USE_DBGUART=ON SRC=src ./build.sh
        cache:
            key: build-cache
            paths:
            - build-stm32/src
        artifacts:
            paths:
            - build-stm32/src/stm32f103-i2c-io-expander.bin
            expire_in: 1 week

    flash:
        tags:
            - test-farm
        stage: flash
        script: st-flash --reset write build-stm32/src/stm32f103-i2c-io-expander.bin 0x8000000
        cache:
            key: build-cache

    run_robot:
        tags:
            - test-farm
        stage: test
        script:
            - cd tests/
            - robot --pythonpath . --outputdir ./results -v I2C_SLAVE:0x08 -v BOARD:nanopi_neo2 -t "Probe STM32" -t "Config output pin" -t "Set stm32 pin high" -t "Read host pin" -t "Reset stm32 pin" -t "Read host pin 2" ./robot-tests/
I’ll use this temporarily in the repo for testing, but you won’t find this file, as I’ll revert it back.
In this file you can see that each stage now has a tags entry that lists which runners can execute each stage. The Yocto images doesn’t have tags for the runners, therefore for this test I’ll remove the previous runners using the web interface and then run this command on each test server:
1
2
gitlab-runner verify --delete
gitlab-runner register
Then you need to enter each parameter like that:
1
2
3
4
5
6
7
8
9
10
11
12
Please enter the gitlab-ci coordinator URL (e.g. https://gitlab.com/):
https://gitlab.com/
Please enter the gitlab-ci token for this runner:
4sFaXz89yJStt1hdKM9z
Please enter the gitlab-ci description for this runner:
[nanopi-neo2]: nanopi-neo2
Please enter the gitlab-ci tags for this runner (comma separated):
test-farm
Registering runner... succeeded                     runner=4sFaXz89
Please enter the executor: parallels, shell, ssh, virtualbox, docker+machine, docker-ssh+machine, docker, docker-ssh, kubernetes, custom:
shell
Runner registered successfully. Feel free to start it, but if it's running already the config should be automatically reloaded!
From the above the important bits are the description (in this case nanopi-neo2) and the tags (in this case test-farm).
Next, I’ve done the same on the nanopi-k1-plus. Please ignore these manual steps here, these will be scripted or included in the Yocto image. This is only for testing and demonstrate the architecture.
Finally, to build the AWS EC2 instance I’ve ran those commands:
1
2
3
4
git clone git@bitbucket.org:dimtass/stm32-cde-template.git
cd stm32-cde-template
packer build stm32-cde-aws-gitlab-runner.json
ln -sf Vagrantfile_aws Vagrantfile
Now edit the Vagrantfile and fill in the aws_keypair_name and aws_ami_name, according to the ones you have in your web EC2 management console (I’ve also explained those steps in the previous post here).
1
2
3
vagrant up
vagrant shh
ps -A | grep gitlab
The last command will display a running instance of the gitlab-runner, but in this case here this is registered to the stm32-cmake-template project of the previous post! That’s because this image was made for that project. Normally I would need to change the Ansible scripts and point to the new repo, but for the demonstration I will just stop the instances, remove the the runner and add a new one that points to this post repo.
So, first I killed the gitlab process in the aws image like this:
1
2
3
4
5
ubuntu@ip-172-31-43-158:~$ ps -A | grep gitlab
 1188 ?        00:00:00 gitlab-runner
ubuntu@ip-172-31-43-158:~$ sudo kill -9 1188
ubuntu@ip-172-31-43-158:~$ gitlab-runner verify --delete
ubuntu@ip-172-31-43-158:~$ gitlab-runner register
And then I’ve filled the following:
1
2
3
4
5
6
7
8
9
10
11
12
Please enter the gitlab-ci coordinator URL (e.g. https://gitlab.com/):
https://gitlab.com/
Please enter the gitlab-ci token for this runner:
4sFaXz89yJStt1hdKM9z
Please enter the gitlab-ci description for this runner:
[ip-172-31-43-158]: aws-stm32-agent
Please enter the gitlab-ci tags for this runner (comma separated):
stm32-builder
Registering runner... succeeded                     runner=4sFaXz89
Please enter the executor: custom, docker, docker-ssh, shell, virtualbox, docker+machine, kubernetes, parallels, ssh, docker-ssh+machine:
shell
Runner registered successfully. Feel free to start it, but if it's running already the config should be automatically reloaded!
The important bits here are again the description which is aws-stm32-agent and the tag which is stm32-builder. Therefore, you see that the tag of this runner is the same with the tag in the build stage in the .gitlab-ci.yml script and the tags of the SBCs are the same with the tags of the flash and test stages.
That’s it! You can now verify the above in the Settings -> CI/CD -> Runners page in the repo. In my case I see this:
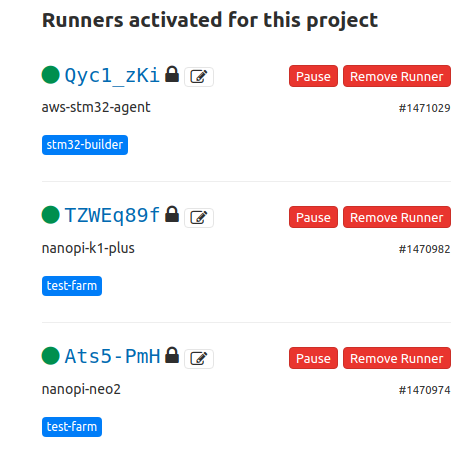
In the image above you see that now each runner has a different description and the nanopi-neo2 and nanopi-k1-plus have the same tag which is test-farm. You can of course do this with a script similar to the meta-test-server/recipes-testtools/gitlab-runner/gitlab-runner/initialize-gitlab-runner.sh in the meta-test-server image.
Here is the successful CI pipeline that the build is done on the AWS EC2 instance and the flash and test stages were executed on the nanopi-k1-plus. You can see from this log here, that the build was done on AWS, I’m pasting a part of the log:
1
2
3
4
5
6
7
8
9
10
11
12
13
14
15
16
17
18
19
20
1 Running with gitlab-runner 12.6.0 (ac8e767a)
2   on aws-stm32-agent Qyc1_zKi
3 Using Shell executor... 00:00
5 Running on ip-172-31-43-158... 00:00
7 Fetching changes with git depth set to 50... 00:01
8 Reinitialized existing Git repository in /home/ubuntu/builds/Qyc1_zKi/0/dimtass/stm32f103-i2c-io-expander/.git/
...
140 real	0m5.309s
141 user	0m4.248s
142 sys	0m0.456s
145 Creating cache build-cache... 00:00
146 Runtime platform                                    arch=amd64 os=linux pid=3735 revision=ac8e767a version=12.6.0
147 build-stm32/src: found 55 matching files
148 No URL provided, cache will be not uploaded to shared cache server. Cache will be stored only locally.
149 Created cache 151
Uploading artifacts... 00:03
152 Runtime platform                                    arch=amd64 os=linux pid=3751 revision=ac8e767a version=12.6.0
153 build-stm32/src/stm32f103-i2c-io-expander.bin: found 1 matching files
154 Uploading artifacts to coordinator... ok            id=393617901 responseStatus=201 Created token=yHW5azBz
156 Job succeeded
In line 152, you see that the arch is amd64, which is correct for the AWS EC2 image. Next here and here are the logs for the flash and test stages. In those logs you can see the runner name now is the nanopi-k1-plus and the arch is arm64.
Also in this pipeline here, you see from this log here that the same AWS EC2 instance as before did the firmware build. Finally from this log here and here, you can verify that the nanopi-neo2 runner flashed its attached STM32 and run the robot test on it.
Now I’ll try to explain the whole process that happened in a simple way. First the pipeline was triggered on the web interface. Then the gitlab server parsed the .gitlab-ci.yml and found that there are 3 stages. Also it found that each stage has a tag. Therefore, it stopped in the first stage and was waiting for any runner with that tag to poll the server. Let’s assume that at some point the gitlab-runner on any of the SBCs polls the server first (this happens by default every 3 secs for all the runners). When the SBCconnected to the server then it posted the repo name, the token, a few other details and also the runner tag. The server checked the tag name of the runner and the stage and it sees that it’s different, so it doesn’t execute the stage on that runner and closes the connection.
After 1-2 secs the gitlab-runner in the AWS EC2 instance with the same tag as the build stage connects to the gitlab server. Then the server verifies both the runner and the tag and then starts to execute commands to the runner via a tunnel. First it git clones the repo to a temporary folder in the AWS EC2 instance storage and then executes the script line. Then the firmware is built and the server downloads the artifact that was requested in the yaml file (see: artifacts in the build stage in .gitlab-ci.yml).
Now that the build stage is successful and the artifact is on the server, the server initiates the next stage and now waits for any runner with the test-farm tag. Of course the EC2 instance can’t execute this stage as it has another tag. Then at some point one of the SBCs is connected and the server takes control of the SBC and executes the flash stage using a tunnel. In this case, because there is an actual ST-LINKv2 USB module connected and also the STM32, then the server uploads the artifact bin firmware on the SBC and then flashes the firmware to the STM32.
Finally, the server in the test stage uses the same runner since it has the proper tag and executes the robot test via the tunnel between the server and the runner. Then all tests passes and the success result is returned.
That’s it. This is pretty much the whole process that happened in the background. Of course, the same process happened in the first architecture with the only difference that because there wasn’t a tag in the stages and the runners, then all the stages were running on the same runner.
Benchmarks
Let’s see a few numbers now. The interesting benchmark is the build time on the AWS EC2 and the two nanopi SBCs. In the following table you can see how much time the build spend in each case.
| Runner | Time is secs |
|---|---|
| AWS EC2 (t2.micro – 1 core) | 5.345s |
| Nanopi-neo2 (4 cores) | 14.413s |
| Nanopi-k1-plus (4 cores) | 12.509s |
| Ryzen 2700X (8-cores/16-threads) | 1.914s |
As you can see from the above table the t2.micro x86_64 instance is by far faster builder than the nanopi SBCs and of course my workstation (Ryzen 2700X) is even more faster. Have in mind that this is a very simple firmware and it builds quite fast. Therefore, you need to consider when you decide your CI pipeline architecture. Is that performance important for you?
Conclusions
That was a long post! If I have to resume all my conclusions in this post series in only one sentence, then this is it:
DevOps for Embedded is tough!
I think that I’ve made a lot of comments during those posts that verify this and the truth is that this was just a simple example. Of course, most of the things I’ve demonstrated are the same regardless the complexity of the project. When it gets really complicated is not in the CI/CD architecture as you have many available options and tools you can use. There’s a tool for everything that you might need! Of course you need to be careful with this… Only use what is simple to understand and maintain in the future and avoid complicated solutions and tools. Also avoid using a ton of different tools to do something that you can do with a few lines of code in any programming language.
Always go for the most simple solution and the one that seems that it can scale to your future needs. Do not assume that you won’t need to scale up in the future even for the same project. Also do not assume that you have to find a single architecture for the whole project life, as this might change during the different project phases. This is why you need to follow one of the main best practise of DevOps, which is IaC. All your infrastructure needs to be code, so you can make changes easy and fast and be able to revert back to a known working state if something goes wrong. That way you can change your architecture easily even during the project.
I don’t know what your opinion is after consuming these information in those posts, but personally I see room for cloud services in the embedded domain. You can use builders in the cloud and also you can run unit tests and mocks to the cloud, too. I believe it’s easier to maintain this kind of infrastructure and also scale it up as you like using an orchestrator like Kubernetes.
On the other hand the cloud agents can’t run tests on the real hardware and be part of a testing farm. In this case your test farm needs real hardware like the examples I’ve demonstrated on this post. Running a testing farm is a huge and demanding task, though and the bigger the farm is the more you need to automate everything. Automation needs to be everywhere. You show that there are many things involved. Even the OS image needs to be part of the IaC. Use Yocto or buildroot or any distro (and provision it with Ansible). Make a CI pipeline also for that image. Just try to automate everything.
Of course, there are things that can’t be automated. For example, if an STM32 board is malfunctioning or a power supply dies or even a single cable has a lot of resistance and creates weird issues, then you can’t use a script to fix this. You can’t write script to create more agents in your farm. All those things are manual work and it needs time, but you can create your farm in a way that you minimize the problems and the time to add new agents or debug problems. Use jigs for example. Use a 3D printer to create custom jigs that the SBC and the STM32 board are fit in there with proper cable management and also check your cables before the installation.
Finally, every project is different and developers have different needs. Find what are the pain points are for your project early and automate the solution.
If you’re an embedded engineer and you’re reading this I hope that you can see the need of DevOps to your project. And if you’re a DevOps engineer new to the embedded domain and reading this, then I hope you grasp the needs of this domain and how complicated can be.
The next post will definitely be a stupid project. The last three were a bit serious… Until then,
Have fun!
Comments powered by Disqus.