Benchmarking the NanoPi R5S
Table of contents
Because this post is quite long and with too many details, I’ve used a TOC so you can browse better.
- Table of contents
- 1. Intro
- 2. The SBC
- 3. NanoPi R5S specs
- 4. Benchmarks
- 4.1 Benchmarks - Storage
- 4.2 Benchmarks - Networking
- Testing a single 2.5G port
- Test case 2 - 2.5G to 2.5G port
- Test case 3 - All ports
- 4.2.1 Benchmarks - Networking - Test case 1 - CAT6A
- 4.2.1.1 Benchmarks - Networking - Test case 1 - CAT6A - R5S->M1
- 4.2.1.2 Benchmarks - Networking - Test case 1 - CAT6A - M1->R5S
- 4.2.1.3 Benchmarks - Networking - Test case 1 - CAT6A - R5S<->M1
- 4.2.1.4 Benchmarks - Networking - Test case 1 - CAT6A - packet generation capabilities - M1->R5S
- 4.2.1.4 Benchmarks - Networking - Test case 1 - CAT6A - packet generation capabilities - R5S->M1
- 4.2.2 Benchmarks - Networking - Test case 1 - CAT7
- 4.2.3 Benchmarks - Networking - Test case 2
- 4.2.4 Benchmarks - Networking - Test case 3
- 5. Conclusions
1. Intro
Today I’m really happy that I’ve received the new Nanopi R5S from FriendlyElec to test it. 1.5 year ago I was able to test the Nanopi R4S and I’ve written two posts, with the last one here.
You can’t really do a 1-to-1 comparison between the two brothers, because the younger one comes with new features that the older brother lacks, but I’ll write more about that next.
2. The SBC
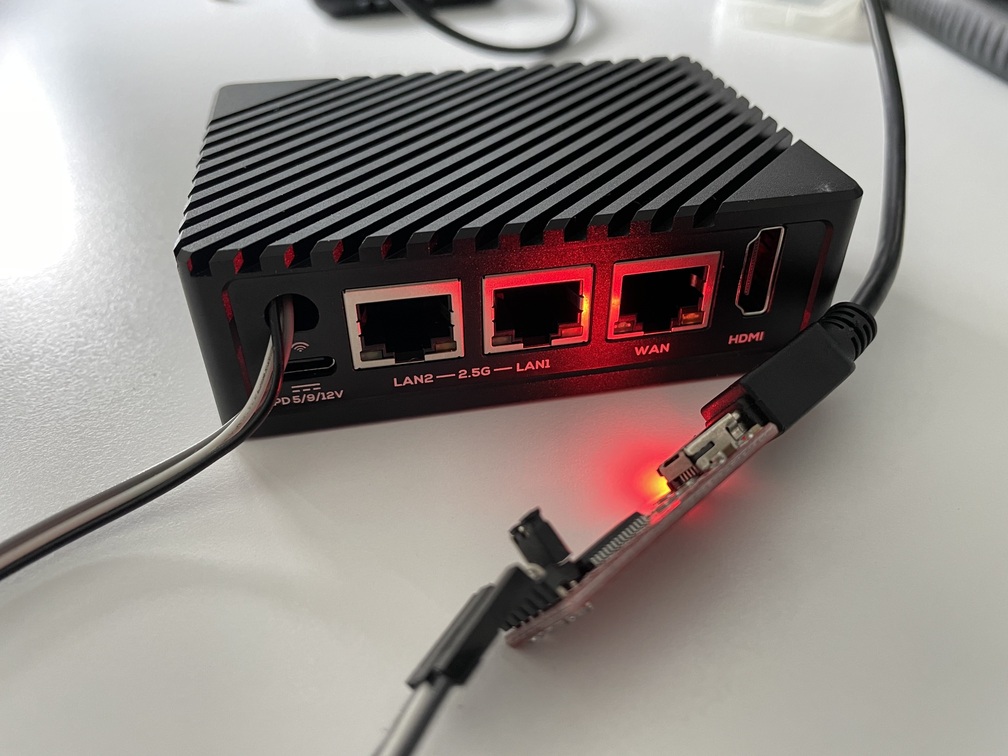
The NanoPi-R5S can be bought as a PCB only or you can also buy the black aluminum case as an extra. The quality of the case is very good and it’s made especially for the R5S. The fit is tight and this time I was really excited when I’ve seen the antenna hole above the USB power port. In my last post for the R4S benchmark here I had to drill my own hole on the case to fit the USB-to-UART adapter in order to get the debug console.
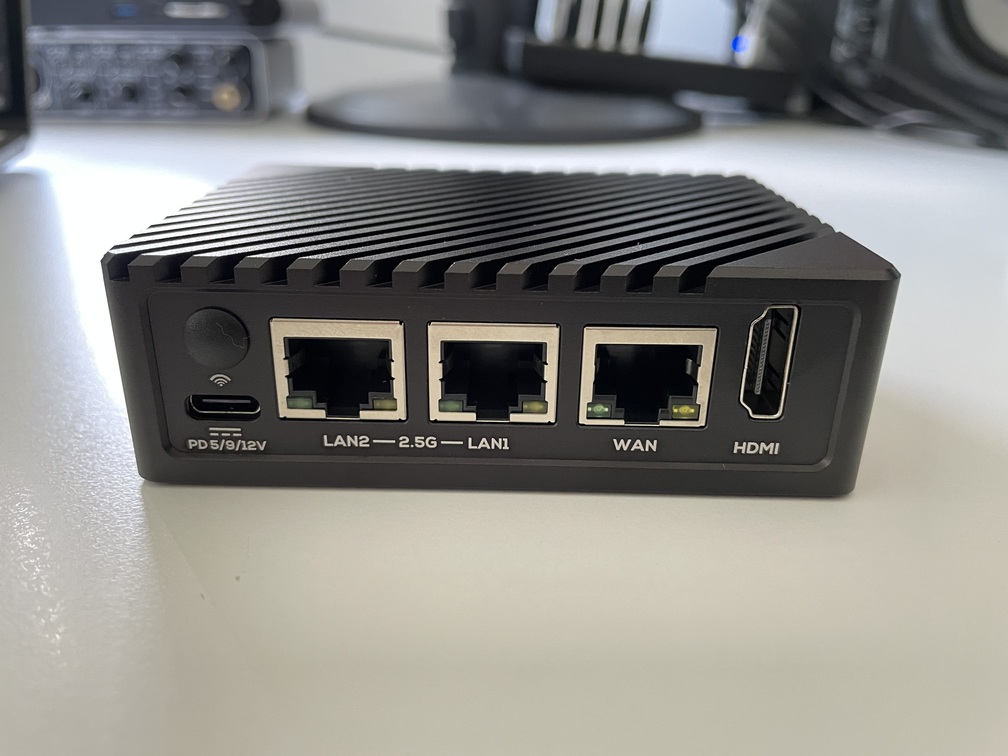 NanoPi-R5S front
2.1 SBC - PCB
The PCB of the R5S is quite populated with several ICs. This is the bottom side.
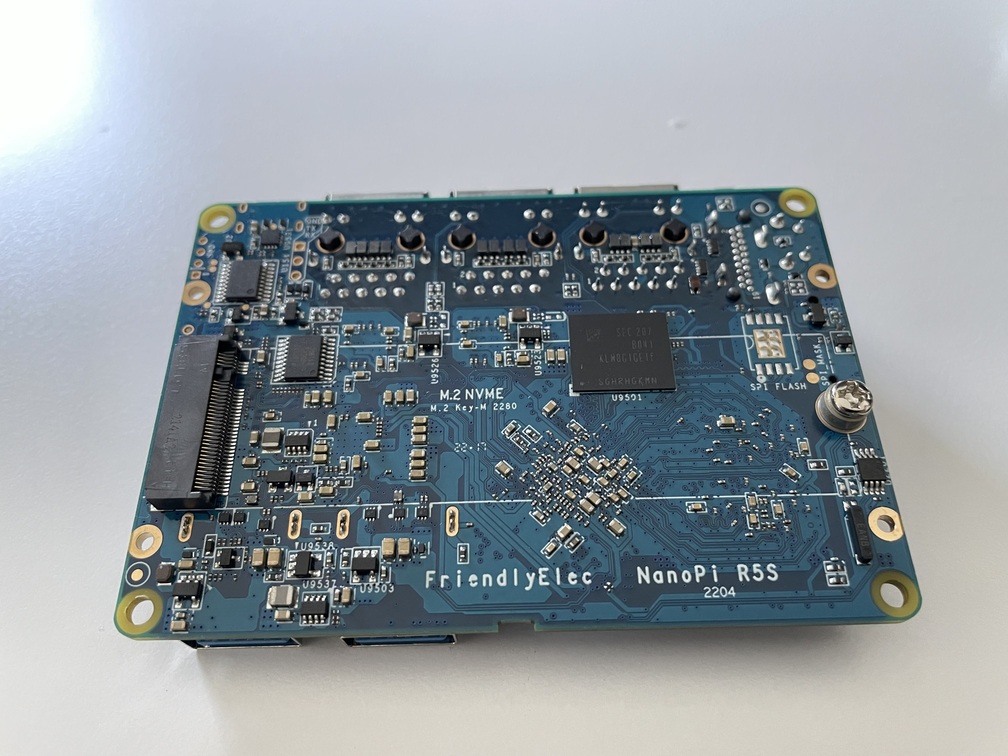 NanoPi-R5S PCB
And this is the top side.
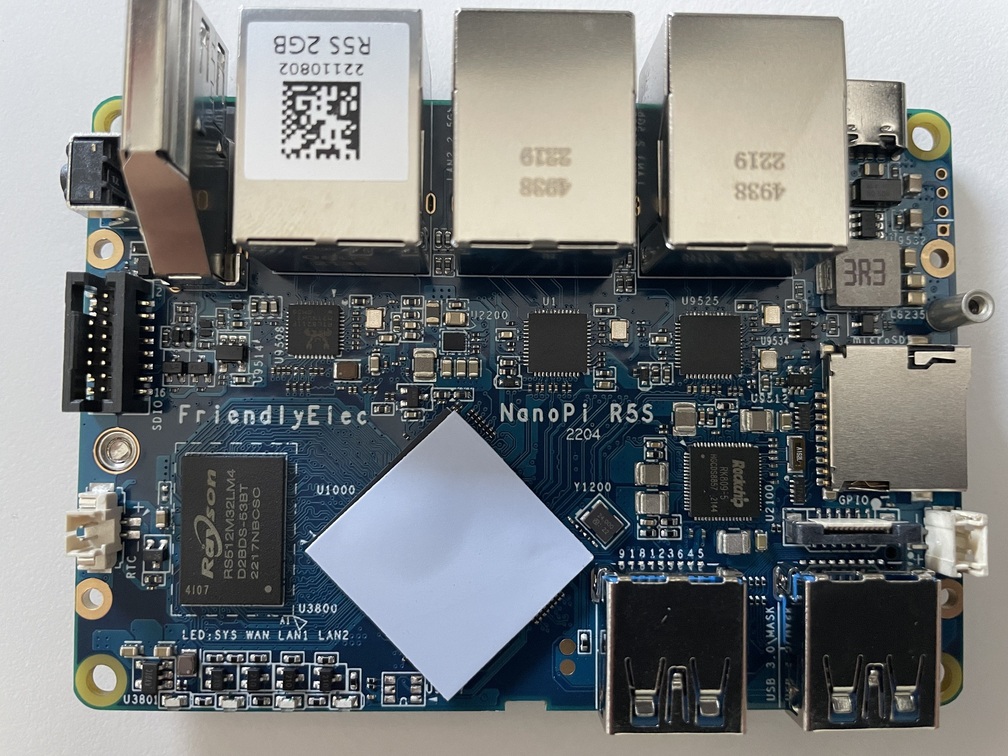 NanoPi-R5S top side
On the bottom side you can see the 8GB eMMC and the PCIe2.1 M.2 connector for the nvme, which is 1x lane. The theoretical bandwidth of x1 lane for the 2.1 PCIe is 500 MB/sec, which means you don’t really have to buy and expensive nvme to populate the slot.
On the top side you can see the 2GB RAM, the 3x network PHYs under the ports, the SoC which comes with a silicon thermal pad and the RK809 PMIC.
There are also 2x USB 3.0 ports, an SD card holder and between the SD card the USB there’s an expansion connector for UART/SPI/PWM. The debug uart (console) is next to the LAN2 2.5G port. This is useful to solder a pinheader and connect a USB-to-UART module to get the output for debugging.
2.2 SBC - UART mod
It’s easy to get the debug console output. All you have to do is to solder a pin-header and then connect a USB-to-UART module.
The default baudrate for the UART is 1.5Mbps, therefore many modules won’t work. I’ve used a module with the FTDI FT232RL chipset.
This is how it looks like with the UART mod.
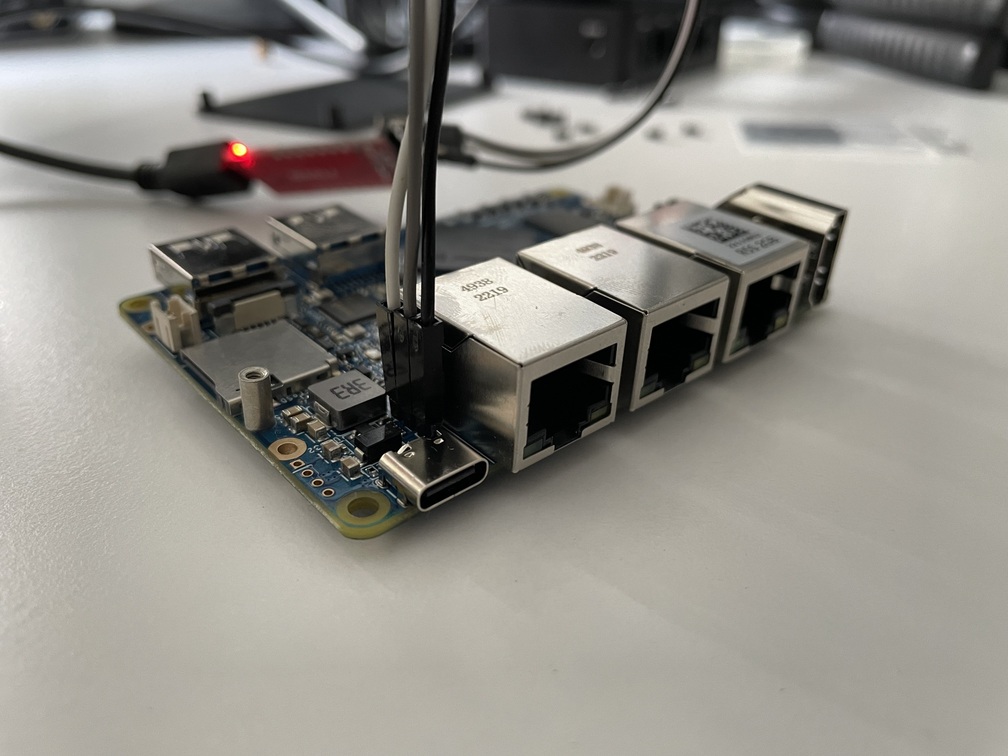 UART mode
And this is how it looks assembled in the case.
 UART mode in case
3. NanoPi R5S specs
The main specs of the NanoPi R5S are listed here, but I’ll mention the ones that I consider the most important.
3.1 Specs - OS
The OS that the R5S came with in the eMMC is a branch of the OpenWrt, which is named FriendlyWrt. This branch includes all the needed drivers and it has the proper device-tree to support the SoC.
This is the uname result:
1
Linux FriendlyWrt 5.10.66 #1 SMP PREEMPT Wed May 18 17:58:14 CST 2022 aarch64 GNU/Linux
Therefore the kernel is based on Linux 5.10.66.
3.2 Specs - SoC
The SoC is the Rockchip RK3568B2 which is a Quad Core Cortex-A55 CPU. On idle the FriendlyWrt reports:
1
2
3
4
5
root@FriendlyWrt:~# cat /sys/devices/system/cpu/cpu*/cpufreq/cpuinfo_max_freq
1992000
1992000
1992000
1992000
Therefore, all the cores are running at almost 2GHz.
3.3 Specs - Network interfaces
Nanopi R5S, has 3 HW network interfaces:
eth0, it’s the SoC’s native 1Gbps network adapter which is mapped to WAN porteth1, it’s the first 2.5Gbps PHY connected on the PCIe buseth2, it’s the second 2.5Gbps PHY connected on the PCIe bus
These are the PCIe devices:
1
2
3
4
5
root@FriendlyWrt:~# lspci
0000:00:00.0 PCI bridge: Rockchip Electronics Co., Ltd RK3568 Remote Signal Processor (rev 01)
0000:01:00.0 Ethernet controller: Realtek Semiconductor Co., Ltd. RTL8125 2.5GbE Controller (rev 05)
0001:10:00.0 PCI bridge: Rockchip Electronics Co., Ltd RK3568 Remote Signal Processor (rev 01)
0001:11:00.0 Ethernet controller: Realtek Semiconductor Co., Ltd. RTL8125 2.5GbE Controller (rev 05)
So, the 2.5Gbps interfaces are based on the RTL8125.
The following is the result of the the ip link show command for reference:
1
2
3
4
5
6
7
8
9
10
11
12
13
14
15
16
17
18
19
root@FriendlyWrt:~# ip link show
1: lo: <LOOPBACK,UP,LOWER_UP> mtu 65536 qdisc noqueue state UNKNOWN mode DEFAULT group default qlen 1000
    link/loopback 00:00:00:00:00:00 brd 00:00:00:00:00:00
2: eth0: <NO-CARRIER,BROADCAST,MULTICAST,UP> mtu 1500 qdisc mq state DOWN mode DEFAULT group default qlen 1000
    link/ether fe:e7:97:xx:xx:xx brd ff:ff:ff:ff:ff:ff permaddr e6:99:c2:xx:xx:xx
3: eth1: <NO-CARRIER,BROADCAST,MULTICAST,UP> mtu 1500 qdisc mq master br-lan state DOWN mode DEFAULT group default qlen 1000
    link/ether fe:e7:97:xx:xx:xx brd ff:ff:ff:ff:ff:ff permaddr ea:99:c2:xx:xx:xx
4: eth2: <NO-CARRIER,BROADCAST,MULTICAST,UP> mtu 1500 qdisc mq master br-lan state DOWN mode DEFAULT group default qlen 1000
    link/ether fe:e7:97:xx:xx:xx brd ff:ff:ff:ff:ff:ff permaddr 6e:0e:34:xx:xx:xx
5: dummy0: <BROADCAST,NOARP> mtu 1500 qdisc noop state DOWN mode DEFAULT group default qlen 1000
    link/ether 56:40:c4:xx:xx:xx brd ff:ff:ff:ff:ff:ff
6: gre0@NONE: <NOARP> mtu 1476 qdisc noop state DOWN mode DEFAULT group default qlen 1000
    link/gre 0.0.0.0 brd 0.0.0.0
7: gretap0@NONE: <BROADCAST,MULTICAST> mtu 1462 qdisc noop state DOWN mode DEFAULT group default qlen 1000
    link/ether 00:00:00:00:00:00 brd ff:ff:ff:ff:ff:ff
8: erspan0@NONE: <BROADCAST,MULTICAST> mtu 1450 qdisc noop state DOWN mode DEFAULT group default qlen 1000
    link/ether 00:00:00:00:00:00 brd ff:ff:ff:ff:ff:ff
14: br-lan: <NO-CARRIER,BROADCAST,MULTICAST,UP> mtu 1500 qdisc noqueue state DOWN mode DEFAULT group default qlen 1000
    link/ether fe:e7:97:xx:xx:xx brd ff:ff:ff:ff:ff:ff
Here, except the eth0-2 we can see also other virtual interfaces used from FriendlyWrt to handle the WAN and LAN interconnections.
- erspan0, is a virtual interface used for port mirroring.
gre0andgretap0, are the GRE tunnel. GRE are IP-over-IP tunnels, which can encapsulate IPv4/IPv6 and unicast/multicast traffic.br-lan, is the bridge network for LAN and WAN.
Finally, this is how IRQ are mapped for each interface to each core.
1
2
3
4
5
6
7
8
9
10
11
12
13
14
15
16
17
18
root@FriendlyWrt:~# cat /proc/interrupts
           CPU0       CPU1       CPU2       CPU3
 13:       6197       4234       4821       4771     GICv3  26 Level     arch_timer
 14:       6496      10384      10959       2961     GICv3 141 Level     rk_timer
 23:       8245          0          0          0     GICv3  78 Level     fdd40000.i2c
 58:          0          0          0         35     GICv3  59 Level     eth0
 59:          0          0          0          0     GICv3  56 Level     eth0
 62:      24315          0          0          0     GICv3  51 Level     mmc2
121:          0          0          0          0   ITS-MSI 142606344 Edge      PCIe PME
123:          0         95          0          0   ITS-MSI 524288 Edge      eth1-0
139:          0          0          8          0   ITS-MSI 524304 Edge      eth1-16
141:          0          0          0          0   ITS-MSI 524306 Edge      eth1-18
144:          0          0          0          2   ITS-MSI 524309 Edge      eth1-21
155:          0          0        748          0   ITS-MSI 143130624 Edge      eth2-0
171:          0         84          0          0   ITS-MSI 143130640 Edge      eth2-16
173:          0          0          0          0   ITS-MSI 143130642 Edge      eth2-18
176:          0          0          0          2   ITS-MSI 143130645 Edge      eth2-21
Err:          0
As you can see eth0 IRQ is mapped on CPU3 and eth1-eth2 on CPU1-2.
You can view the networking benchmarks here.
3.4 Specs - Storage
There is an internal 8GB eMMC mapped in mmcblk2 where the OS was installed and an SD card slot mapped to mmcblk0. I’ve also installed a Crucial P2 1TB nvme.
This is the layout of all storage devices:
1
2
3
4
5
6
7
8
9
10
11
12
13
14
15
16
17
18
root@FriendlyWrt:~# lsblk
NAME         MAJ:MIN RM   SIZE RO TYPE MOUNTPOINTS
mmcblk2      179:0    0   7.3G  0 disk
├─mmcblk2p1  179:1    0     4M  0 part
├─mmcblk2p2  179:2    0     4M  0 part
├─mmcblk2p3  179:3    0     4M  0 part
├─mmcblk2p4  179:4    0    16M  0 part
├─mmcblk2p5  179:5    0    40M  0 part
├─mmcblk2p6  179:6    0    32M  0 part
├─mmcblk2p7  179:7    0    32M  0 part
├─mmcblk2p8  179:8    0   368M  0 part
└─mmcblk2p9  179:9    0   6.8G  0 part
mmcblk2boot0 179:32   0     4M  1 disk
mmcblk2boot1 179:64   0     4M  1 disk
mmcblk0      179:96   0 119.1G  0 disk
└─mmcblk0p1  179:97   0 119.1G  0 part
zram0        253:0    0     0B  0 disk
nvme0n1      259:0    0 931.5G  0 disk
This is how the nvme SSD drive fits on the motherboard. 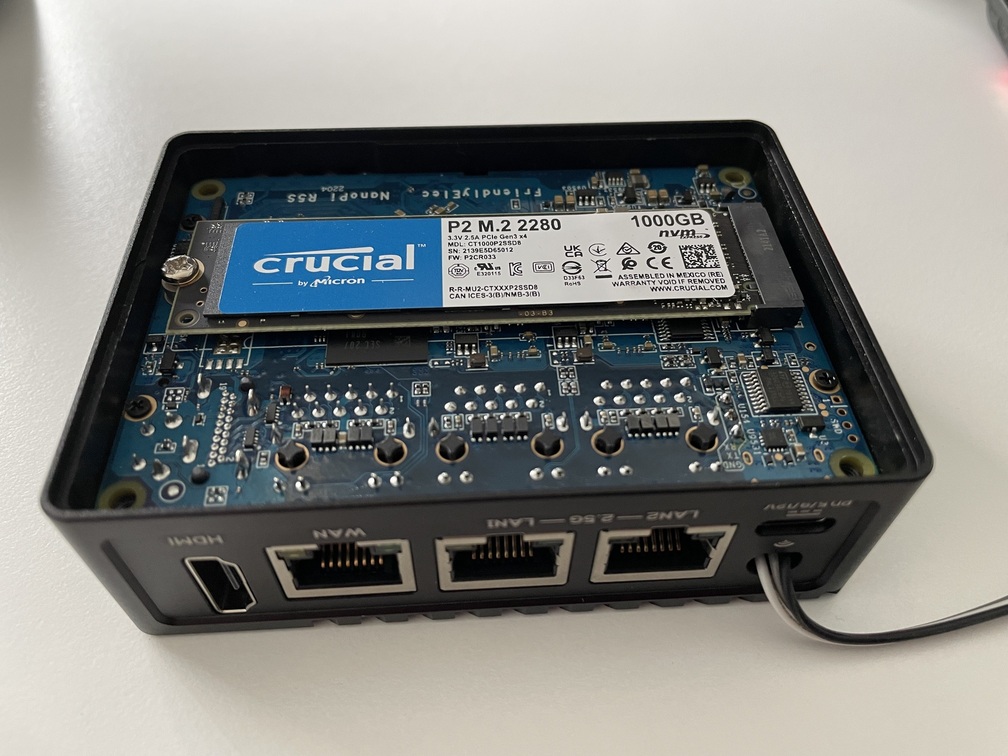 The nvme installed on the board
This nvme drive is much faster compared to the 1x lave PCIe2.1 interface, so I don’t expect to get the full bandwidth, but it should be close to the theoretical 500 MB/sec.
You can view the benchmarks here.
4. Benchmarks
In this section I’ll list some of the benchmarks I’ve made so far. This will updated in the future with any new tests I’ll perform.
4.1 Benchmarks - Storage
This is the layout of all storage devices I’ve used in the benchmark:
1
2
3
4
5
6
7
8
9
10
11
12
13
14
15
16
17
18
19
root@FriendlyWrt:~# lsblk
NAME         MAJ:MIN RM   SIZE RO TYPE MOUNTPOINTS
mmcblk2      179:0    0   7.3G  0 disk
├─mmcblk2p1  179:1    0     4M  0 part
├─mmcblk2p2  179:2    0     4M  0 part
├─mmcblk2p3  179:3    0     4M  0 part
├─mmcblk2p4  179:4    0    16M  0 part
├─mmcblk2p5  179:5    0    40M  0 part
├─mmcblk2p6  179:6    0    32M  0 part
├─mmcblk2p7  179:7    0    32M  0 part
├─mmcblk2p8  179:8    0   368M  0 part
└─mmcblk2p9  179:9    0   6.8G  0 part
mmcblk2boot0 179:32   0     4M  1 disk
mmcblk2boot1 179:64   0     4M  1 disk
mmcblk0      179:96   0 119.1G  0 disk
└─mmcblk0p1  179:97   0 119.1G  0 part
zram0        253:0    0     0B  0 disk
nvme0n1      259:0    0 931.5G  0 disk
└─nvme0n1p1  259:1    0 931.5G  0 part
Where:
mmcblk2, the eMMCmmcblk0, the SD card which in my case is the SandDisk Extreme 128GB V30 A2nvme0n1, the Crucial P2 1TB nvme drive.
The nvme drive is formatted as EXT4.
For the benchmark I’ve used hdparm and f3.
f3 - Fight Flash Fraud is another benchmarking tool. I’m not sure how accurate that is but I’ve used it in any case. Since f3 is not available on FriendlyWrt repos, I’ve cross-build it statically and then scp the fread and fwrite executables to the NanoPi-R5S. Have in mind that FriendlyWrt is build with musl therefore you shouldn’t build it as a dynamic ELF on your x86_64 host.
To build f3 on my host I’ve just used these commands:
1
2
3
4
5
6
/opt/toolchains/gcc-arm-8.3-2019.03-x86_64-aarch64-linux-gnu/bin/aarch64-linux-gnu-gcc -std=c99 -Wall -Wextra -pedantic -MMD -ggdb   -c -o utils.o utils.c
/opt/toolchains/gcc-arm-8.3-2019.03-x86_64-aarch64-linux-gnu/bin/aarch64-linux-gnu-gcc -std=c99 -Wall -Wextra -pedantic -MMD -ggdb   -c -o libflow.o libflow.c
/opt/toolchains/gcc-arm-8.3-2019.03-x86_64-aarch64-linux-gnu/bin/aarch64-linux-gnu-gcc -std=c99 -Wall -Wextra -pedantic -MMD -ggdb   -c -o f3write.o f3write.c
/opt/toolchains/gcc-arm-8.3-2019.03-x86_64-aarch64-linux-gnu/bin/aarch64-linux-gnu-gcc -static -o f3write utils.o libflow.o f3write.o  -lm
/opt/toolchains/gcc-arm-8.3-2019.03-x86_64-aarch64-linux-gnu/bin/aarch64-linux-gnu-gcc -std=c99 -Wall -Wextra -pedantic -MMD -ggdb   -c -o f3read.o f3read.c
/opt/toolchains/gcc-arm-8.3-2019.03-x86_64-aarch64-linux-gnu/bin/aarch64-linux-gnu-gcc -static -o f3read utils.o libflow.o f3read.o  -lm
Of course you need to point to the proper path of your aarch64 toolchain to build it. Finally, I’ve copied the files in the NanoPi-R5S.
1
2
scp f3read root@192.168.0.81:/root
scp f3write root@192.168.0.81:/root
TL;DR these are the results:
| hdparm (MB/sec) | dd (MB/sec) | f3write (MB/sec) | f3read (MB/sec) | |
|---|---|---|---|---|
| eMMC | 162.22 | 153 | 33.77 | 114.83 |
| SD | 62.89 | 59 | 33.25 | 57.80 |
| nvme | 388.92 | 316 | 73.15 | 175.02 |
If you want to see the details for each test then keep scrolling, otherwise click here to jump to the networking benchmarks.
4.1.1 Benchmarks - Storage - hdparm
eMMC
The results for the eMMC are:
1
2
3
4
5
root@FriendlyWrt:~# hdparm -tT /dev/mmcblk2

/dev/mmcblk2:
 Timing cached reads:   2036 MB in  2.00 seconds = 1017.76 MB/sec
 Timing buffered disk reads: 488 MB in  3.01 seconds = 162.22 MB/sec
Therefore, you can expect ~160MB/sec reads from the eMMC, which I personally consider more than enough for my use case.
SD
The results for the SD card are:
1
2
3
4
5
root@FriendlyWrt:~# hdparm -tT /dev/mmcblk0

/dev/mmcblk0:
 Timing cached reads:   2046 MB in  2.00 seconds = 1022.70 MB/sec
 Timing buffered disk reads: 190 MB in  3.02 seconds =  62.89 MB/sec
nvme
The results for the nvme drive are:
1
2
3
4
5
root@FriendlyWrt:~# hdparm -tT /dev/nvme0n1p1

/dev/nvme0n1p1:
 Timing cached reads:   1920 MB in  2.00 seconds = 959.98 MB/sec
 Timing buffered disk reads: 1168 MB in  3.00 seconds = 388.92 MB/sec
The results are a far less from the theoretical advertised read speed of the drive which is 2400MB/sec. From other reviews of the drive though I’ve seen that it actually achieve 2100MB/sec read speeds, see the here for reference. But as I’ve mentioned the actual theoretical limit of the 1z PCIe is 500 MB/sec. Therefore, the actual speed is 25% less than than the maximum theoretical speed.
4.1.2 Benchmarks - Storage - dd read benchmarks
eMMC
1
2
3
4
root@FriendlyWrt:~# dd if=/dev/mmcblk2 of=/dev/null bs=4k count=1000000 oflag=dsync
1000000+0 records in
1000000+0 records out
4096000000 bytes (4.1 GB, 3.8 GiB) copied, 26.7254 s, 153 MB/s
SD
The results for the SD card are:
1
2
3
4
root@FriendlyWrt:~# dd if=/dev/mmcblk0 of=/dev/null bs=4k count=1000000 oflag=dsync
1000000+0 records in
1000000+0 records out
4096000000 bytes (4.1 GB, 3.8 GiB) copied, 69.371 s, 59.0 MB/s
nvme
The results for the nvme drive are:
1
2
3
4
root@FriendlyWrt:~# dd if=/dev/nvme0n1p1 of=/dev/null bs=4k count=1000000 oflag=dsync
1000000+0 records in
1000000+0 records out
4096000000 bytes (4.1 GB, 3.8 GiB) copied, 12.9644 s, 316 MB/s
4.1.3 Benchmarks - Storage - f3 benchmarks
The f3 bench mark is to be considered a similar to real-life benchmark, because the CPU needs to perform calculations while writting and reading the data. Well, again it depends the use case, but I like to consider this as the worst case real-scenario.
eMMC
The f3write results for the eMMC are:
1
2
3
4
5
6
7
8
9
10
11
12
13
14
15
root@FriendlyWrt:~# ./f3write /root/f3test
F3 write 8.0
Copyright (C) 2010 Digirati Internet LTDA.
This is free software; see the source for copying conditions.

Free space: 6.68 GB
Creating file 1.h2w ... OK!
Creating file 2.h2w ... OK!
Creating file 3.h2w ... OK!
Creating file 4.h2w ... OK!
Creating file 5.h2w ... OK!
Creating file 6.h2w ... OK!
Creating file 7.h2w ... OK!
Free space: 16.00 MB
Average writing speed: 33.77 MB/s
The f3read results for the eMMC are:
1
2
3
4
5
6
7
8
9
10
11
12
13
14
15
16
17
18
19
20
root@FriendlyWrt:~# ./f3read /root/f3test
F3 read 8.0
Copyright (C) 2010 Digirati Internet LTDA.
This is free software; see the source for copying conditions.

                  SECTORS      ok/corrupted/changed/overwritten
Validating file 1.h2w ... 2097152/        0/      0/      0
Validating file 2.h2w ... 2097152/        0/      0/      0
Validating file 3.h2w ... 2097152/        0/      0/      0
Validating file 4.h2w ... 2097152/        0/      0/      0
Validating file 5.h2w ... 2097152/        0/      0/      0
Validating file 6.h2w ... 2097152/        0/      0/      0
Validating file 7.h2w ... 1401952/        0/      0/      0

  Data OK: 6.67 GB (13984864 sectors)
Data LOST: 0.00 Byte (0 sectors)
               Corrupted: 0.00 Byte (0 sectors)
        Slightly changed: 0.00 Byte (0 sectors)
             Overwritten: 0.00 Byte (0 sectors)
Average reading speed: 114.83 MB/s
SD
The f3write results for the SD card are:
1
2
3
4
5
6
7
8
9
10
11
12
13
14
15
16
root@FriendlyWrt:~# ./f3write --end-at=8 /mnt/sd
F3 write 8.0
Copyright (C) 2010 Digirati Internet LTDA.
This is free software; see the source for copying conditions.

Free space: 119.05 GB
Creating file 1.h2w ... OK!
Creating file 2.h2w ... OK!
Creating file 3.h2w ... OK!
Creating file 4.h2w ... OK!
Creating file 5.h2w ... OK!
Creating file 6.h2w ... OK!
Creating file 7.h2w ... OK!
Creating file 8.h2w ... OK!
Free space: 111.05 GB
Average writing speed: 33.25 MB/s
The f3read results for the SD card are:
1
2
3
4
5
6
7
8
9
10
11
12
13
14
15
16
17
18
19
20
21
root@FriendlyWrt:~# ./f3read --end-at=8 /mnt/sd
F3 read 8.0
Copyright (C) 2010 Digirati Internet LTDA.
This is free software; see the source for copying conditions.

                  SECTORS      ok/corrupted/changed/overwritten
Validating file 1.h2w ... 2097152/        0/      0/      0
Validating file 2.h2w ... 2097152/        0/      0/      0
Validating file 3.h2w ... 2097152/        0/      0/      0
Validating file 4.h2w ... 2097152/        0/      0/      0
Validating file 5.h2w ... 2097152/        0/      0/      0
Validating file 6.h2w ... 2097152/        0/      0/      0
Validating file 7.h2w ... 2097152/        0/      0/      0
Validating file 8.h2w ... 2097152/        0/      0/      0

  Data OK: 8.00 GB (16777216 sectors)
Data LOST: 0.00 Byte (0 sectors)
	       Corrupted: 0.00 Byte (0 sectors)
	Slightly changed: 0.00 Byte (0 sectors)
	     Overwritten: 0.00 Byte (0 sectors)
Average reading speed: 57.80 MB/s
NVME
The f3write results for the nvme are:
1
2
3
4
5
6
7
8
9
10
11
12
13
14
15
16
root@FriendlyWrt:~# ./f3write --end-at=8 /mnt/nvme
F3 write 8.0
Copyright (C) 2010 Digirati Internet LTDA.
This is free software; see the source for copying conditions.

Free space: 915.82 GB
Creating file 1.h2w ... OK!
Creating file 2.h2w ... OK!
Creating file 3.h2w ... OK!
Creating file 4.h2w ... OK!
Creating file 5.h2w ... OK!
Creating file 6.h2w ... OK!
Creating file 7.h2w ... OK!
Creating file 8.h2w ... OK!
Free space: 907.82 GB
Average writing speed: 73.15 MB/s
The f3read results for the nvme are:
1
2
3
4
5
6
7
8
9
10
11
12
13
14
15
16
17
18
19
20
21
root@FriendlyWrt:~# ./f3read --end-at=8 /mnt/nvme
F3 read 8.0
Copyright (C) 2010 Digirati Internet LTDA.
This is free software; see the source for copying conditions.

                  SECTORS      ok/corrupted/changed/overwritten
Validating file 1.h2w ... 2097152/        0/      0/      0
Validating file 2.h2w ... 2097152/        0/      0/      0
Validating file 3.h2w ... 2097152/        0/      0/      0
Validating file 4.h2w ... 2097152/        0/      0/      0
Validating file 5.h2w ... 2097152/        0/      0/      0
Validating file 6.h2w ... 2097152/        0/      0/      0
Validating file 7.h2w ... 2097152/        0/      0/      0
Validating file 8.h2w ... 2097152/        0/      0/      0

  Data OK: 8.00 GB (16777216 sectors)
Data LOST: 0.00 Byte (0 sectors)
               Corrupted: 0.00 Byte (0 sectors)
        Slightly changed: 0.00 Byte (0 sectors)
             Overwritten: 0.00 Byte (0 sectors)
Average reading speed: 175.02 MB/s
4.2 Benchmarks - Networking
This is a TL;DR table with all the results. If you want to see more details for each test then keep scrolling to get a more deep dive.
| Test case 1 (Gbits/sec) | Test case 2 (Gbits/sec) | Test case 3 (Gbits/sec) | |
|---|---|---|---|
| R5S -> M1 (CAT.6a) | 1.49 | TBD | TBD |
| M1 -> R5S (CAT.6a) | 2.14 | TBD | TBD |
| R5S <-> M1 (CAT.6a) | 1.37 (TX) / 159 (RX) | TBD | TBD |
| R5S -> M1 (CAT.7) | 1.49 | TBD | TBD |
| M1 -> R5S (CAT.7) | 2.14 | TBD | TBD |
| R5S <-> M1 (CAT.7) | 1.37 (TX) / 159 (RX) | TBD | TBD |
The 3 different test cases are described below.
Testing a single 2.5G port
This is the first test case:
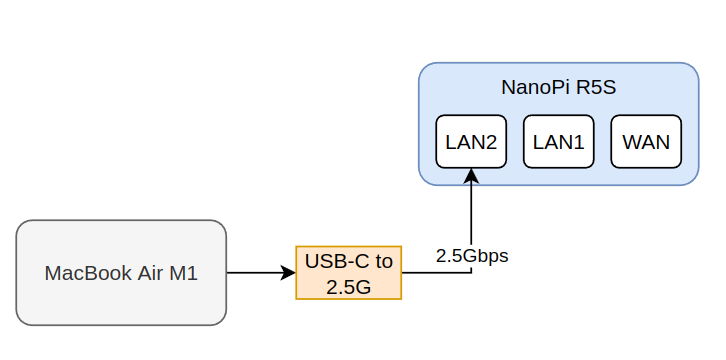
In the above diagram you can see that the Macbook Air M1 is connected via the USB-C to 2.5G ethernet adapter to the 2.5G LAN2 port of the NanoPi-R5S.
I’ll run this test with 2 different cables:
- 20cm CAT.6a rated for 500MHz
- 100cm CAT.7 cable rated for 600MHz
The reason for using two different cables is to check if the different cable category affects the actual bandwidth that the R5S can provide.
Test case 2 - 2.5G to 2.5G port
This is the second test case diagram:

In this case, I’ll test the interconnection between the 2.5G ports using two different external hosts.
This test is not done yet, as I need to buy a second 2.5G USB-C to ethernet interface.
Test case 3 - All ports
This is the second test case diagram:

In this case, I’ll test all the ports at the same time, which pretty much emulated a router usage
This test is not done yet, as I need to buy a second 2.5G USB-C to ethernet interface.
4.2.1 Benchmarks - Networking - Test case 1 - CAT6A
This test is performed with a CAT.6A patch cable of 20cm, which is characterized for 500MHz.
4.2.1.1 Benchmarks - Networking - Test case 1 - CAT6A - R5S->M1
The first test is running for 2 mins and with 2 parallel TCP streams
| Host | Command |
|---|---|
| Mac M1 w/ USB-C 2.5G | iperf -s |
| NanoPi R5S (LAN2) | iperf -c 192.168.2.20 -t 120 -d -P 2 |
Click here to view full console output…
1
2
3
4
5
6
7
8
9
10
11
12
13
14
15
16
17
18
19
20
21
22
23
24
25
26
27
28
29
30
31
32
33
34
35
36
37
38
39
40
41
42
43
44
45
46
47
48
49
50
51
52
53
54
55
56
57
58
59
60
61
62
63
64
65
66
67
68
69
send_results
{
        "cpu_util_total":       99.894594260395,
        "cpu_util_user":        2.53878014645815,
        "cpu_util_system":      97.3558149471838,
        "sender_has_retransmits":       1,
        "congestion_used":      "bbr",
        "streams":      [{
                        "id":   1,
                        "bytes":        11559632896,
                        "retransmits":  2,
                        "jitter":       0,
                        "errors":       0,
                        "packets":      0,
                        "start_time":   0,
                        "end_time":     120.000356
                }, {
                        "id":   3,
                        "bytes":        10766254080,
                        "retransmits":  0,
                        "jitter":       0,
                        "errors":       0,
                        "packets":      0,
                        "start_time":   0,
                        "end_time":     120.000578
                }]
}
get_results
{
        "cpu_util_total":       12.895311139359134,
        "cpu_util_user":        1.0562188759244822,
        "cpu_util_system":      11.839089763429422,
        "sender_has_retransmits":       -1,
        "streams":      [{
                        "id":   1,
                        "bytes":        11559632896,
                        "retransmits":  -1,
                        "jitter":       0,
                        "errors":       0,
                        "packets":      0,
                        "start_time":   0,
                        "end_time":     119.99968
                }, {
                        "id":   3,
                        "bytes":        10766254080,
                        "retransmits":  -1,
                        "jitter":       0,
                        "errors":       0,
                        "packets":      0,
                        "start_time":   0,
                        "end_time":     119.999681
                }]
}
interval_len 0.994603 bytes_transferred 102760448
interval forces keep
interval_len 0.994474 bytes_transferred 85203344
interval forces keep
- - - - - - - - - - - - - - - - - - - - - - - - -
[  5] 119.01-120.00 sec  98.0 MBytes   827 Mbits/sec    0    348 KBytes
[  7] 119.01-120.00 sec  81.3 MBytes   685 Mbits/sec    0    331 KBytes
[SUM] 119.01-120.00 sec   179 MBytes  1.51 Gbits/sec    0
- - - - - - - - - - - - - - - - - - - - - - - - -
[ ID] Interval           Transfer     Bitrate         Retr
[  5]   0.00-120.00 sec  10.8 GBytes   771 Mbits/sec    2             sender
[  5]   0.00-120.00 sec  10.8 GBytes   771 Mbits/sec                  receiver
[  7]   0.00-120.00 sec  10.0 GBytes   718 Mbits/sec    0             sender
[  7]   0.00-120.00 sec  10.0 GBytes   718 Mbits/sec                  receiver
[SUM]   0.00-120.00 sec  20.8 GBytes  1.49 Gbits/sec    2             sender
[SUM]   0.00-120.00 sec  20.8 GBytes  1.49 Gbits/sec                  receiver
4.2.1.2 Benchmarks - Networking - Test case 1 - CAT6A - M1->R5S
The second test is running for 120 secs, 2x parallel streams and in reverse mode.
Reverse mode means that the Mac M1 with the USB-C dongle will send data to the NanoPi R4S.
| Host | Command |
|---|---|
| Mac M1 w/ USB-C 2.5G | iperf -s |
| NanoPi R4S (LAN2) | iperf3 -c 192.168.2.20 -t 120 -d -P 2 -R |
Click here to view full console output…
1
2
3
4
5
6
7
8
9
10
11
12
13
14
15
16
17
18
19
20
21
22
23
24
25
26
27
28
29
30
31
32
33
34
35
36
37
38
39
40
41
42
43
44
45
46
47
48
49
50
51
52
53
54
55
56
57
58
59
60
61
62
63
64
65
66
67
68
69
send_results
{
        "cpu_util_total":       96.7729033803073,
        "cpu_util_user":        1.3110703132948434,
        "cpu_util_system":      95.461833900263372,
        "sender_has_retransmits":       -1,
        "congestion_used":      "bbr",
        "streams":      [{
                        "id":   1,
                        "bytes":        16135906864,
                        "retransmits":  -1,
                        "jitter":       0,
                        "errors":       0,
                        "packets":      0,
                        "start_time":   0,
                        "end_time":     120.000615
                }, {
                        "id":   3,
                        "bytes":        16003816384,
                        "retransmits":  -1,
                        "jitter":       0,
                        "errors":       0,
                        "packets":      0,
                        "start_time":   0,
                        "end_time":     120.000812
                }]
}
get_results
{
        "cpu_util_total":       79.228332785308552,
        "cpu_util_user":        0.41793856948410563,
        "cpu_util_system":      78.8103925494625,
        "sender_has_retransmits":       0,
        "streams":      [{
                        "id":   1,
                        "bytes":        16140101168,
                        "retransmits":  -1,
                        "jitter":       0,
                        "errors":       0,
                        "packets":      0,
                        "start_time":   0,
                        "end_time":     120.02186
                }, {
                        "id":   3,
                        "bytes":        16008010688,
                        "retransmits":  -1,
                        "jitter":       0,
                        "errors":       0,
                        "packets":      0,
                        "start_time":   0,
                        "end_time":     120.02186
                }]
}
interval_len 1.000521 bytes_transferred 108068584
interval forces keep
interval_len 1.000606 bytes_transferred 85744768
interval forces keep
- - - - - - - - - - - - - - - - - - - - - - - - -
[  5] 119.00-120.00 sec   103 MBytes   864 Mbits/sec
[  7] 119.00-120.00 sec  81.8 MBytes   686 Mbits/sec
[SUM] 119.00-120.00 sec   185 MBytes  1.55 Gbits/sec
- - - - - - - - - - - - - - - - - - - - - - - - -
[ ID] Interval           Transfer     Bitrate
[  5]   0.00-120.02 sec  15.0 GBytes  1.08 Gbits/sec                  sender
[  5]   0.00-120.00 sec  15.0 GBytes  1.08 Gbits/sec                  receiver
[  7]   0.00-120.02 sec  14.9 GBytes  1.07 Gbits/sec                  sender
[  7]   0.00-120.00 sec  14.9 GBytes  1.07 Gbits/sec                  receiver
[SUM]   0.00-120.02 sec  29.9 GBytes  2.14 Gbits/sec                  sender
[SUM]   0.00-120.00 sec  29.9 GBytes  2.14 Gbits/sec                  receiver
As you can see, the reverse mode is much faster and achieves 2.14 Gbits/sec!
4.2.1.3 Benchmarks - Networking - Test case 1 - CAT6A - R5S<->M1
The second test is running for 120 secs, 2x parallel streams and in bidirectional mode.
Bidirectional mode means that the Mac M1 with the USB-C dongle will send data to the NanoPi R5S and then the opposite in full-duplex mode. This is the worst of the worsts case scenario you can get.
| Host | Command |
|---|---|
| Mac M1 w/ USB-C 2.5G | iperf -s |
| NanoPi R5S (LAN2) | iperf3 -c 192.168.2.20 -t 120 -d -P 2 –bidir |
Click here to view full console output…
1
2
3
4
5
6
7
8
9
10
11
12
13
14
15
16
17
18
19
20
21
22
23
24
25
26
27
28
29
30
31
32
33
34
35
36
37
38
39
40
41
42
43
44
45
46
47
48
49
50
51
52
53
54
55
56
57
58
59
60
61
62
63
64
65
66
67
68
69
70
71
72
73
74
75
76
77
78
79
80
81
82
83
84
85
86
87
88
89
90
91
92
93
94
95
96
97
98
99
100
101
102
103
104
105
106
107
108
109
110
111
112
113
114
115
116
117
118
send_results
{
        "cpu_util_total":       99.908560731364176,
        "cpu_util_user":        2.80259866958722,
        "cpu_util_system":      97.105964561346923,
        "sender_has_retransmits":       1,
        "congestion_used":      "bbr",
        "streams":      [{
                        "id":   1,
                        "bytes":        9695789056,
                        "retransmits":  0,
                        "jitter":       0,
                        "errors":       0,
                        "packets":      0,
                        "start_time":   0,
                        "end_time":     120.000561
                }, {
                        "id":   3,
                        "bytes":        10881466368,
                        "retransmits":  0,
                        "jitter":       0,
                        "errors":       0,
                        "packets":      0,
                        "start_time":   0,
                        "end_time":     120.000648
                }, {
                        "id":   4,
                        "bytes":        1173286984,
                        "retransmits":  -1,
                        "jitter":       0,
                        "errors":       0,
                        "packets":      0,
                        "start_time":   0,
                        "end_time":     120.000871
                }, {
                        "id":   5,
                        "bytes":        1173307256,
                        "retransmits":  -1,
                        "jitter":       0,
                        "errors":       0,
                        "packets":      0,
                        "start_time":   0,
                        "end_time":     120.00124
                }]
}
get_results
{
        "cpu_util_total":       11.915361615820213,
        "cpu_util_user":        1.0039928270691434,
        "cpu_util_system":      10.911359622385747,
        "sender_has_retransmits":       0,
        "streams":      [{
                        "id":   1,
                        "bytes":        9695789056,
                        "retransmits":  -1,
                        "jitter":       0,
                        "errors":       0,
                        "packets":      0,
                        "start_time":   0,
                        "end_time":     120.003843
                }, {
                        "id":   3,
                        "bytes":        10881466368,
                        "retransmits":  -1,
                        "jitter":       0,
                        "errors":       0,
                        "packets":      0,
                        "start_time":   0,
                        "end_time":     120.003843
                }, {
                        "id":   4,
                        "bytes":        1192792280,
                        "retransmits":  -1,
                        "jitter":       0,
                        "errors":       0,
                        "packets":      0,
                        "start_time":   0,
                        "end_time":     120.003843
                }, {
                        "id":   5,
                        "bytes":        1185447680,
                        "retransmits":  -1,
                        "jitter":       0,
                        "errors":       0,
                        "packets":      0,
                        "start_time":   0,
                        "end_time":     120.003843
                }]
}
interval_len 0.988212 bytes_transferred 79691776
interval forces keep
interval_len 0.988202 bytes_transferred 92405760
interval forces keep
interval_len 0.988202 bytes_transferred 9437184
interval forces keep
interval_len 0.988202 bytes_transferred 9437184
interval forces keep
- - - - - - - - - - - - - - - - - - - - - - - - -
[  5][TX-C] 119.01-120.00 sec  76.0 MBytes   645 Mbits/sec    0    320 KBytes
[  7][TX-C] 119.01-120.00 sec  88.1 MBytes   748 Mbits/sec    0    322 KBytes
[SUM][TX-C] 119.01-120.00 sec   164 MBytes  1.39 Gbits/sec    0
[  9][RX-C] 119.01-120.00 sec  9.00 MBytes  76.4 Mbits/sec
[ 11][RX-C] 119.01-120.00 sec  9.00 MBytes  76.4 Mbits/sec
[SUM][RX-C] 119.01-120.00 sec  18.0 MBytes   153 Mbits/sec
- - - - - - - - - - - - - - - - - - - - - - - - -
[ ID][Role] Interval           Transfer     Bitrate         Retr
[  5][TX-C]   0.00-120.00 sec  9.03 GBytes   646 Mbits/sec    0             sender
[  5][TX-C]   0.00-120.00 sec  9.03 GBytes   646 Mbits/sec                  receiver
[  7][TX-C]   0.00-120.00 sec  10.1 GBytes   725 Mbits/sec    0             sender
[  7][TX-C]   0.00-120.00 sec  10.1 GBytes   725 Mbits/sec                  receiver
[SUM][TX-C]   0.00-120.00 sec  19.2 GBytes  1.37 Gbits/sec    0             sender
[SUM][TX-C]   0.00-120.00 sec  19.2 GBytes  1.37 Gbits/sec                  receiver
[  9][RX-C]   0.00-120.00 sec  1.11 GBytes  79.5 Mbits/sec                  sender
[  9][RX-C]   0.00-120.00 sec  1.09 GBytes  78.2 Mbits/sec                  receiver
[ 11][RX-C]   0.00-120.00 sec  1.10 GBytes  79.0 Mbits/sec                  sender
[ 11][RX-C]   0.00-120.00 sec  1.09 GBytes  78.2 Mbits/sec                  receiver
[SUM][RX-C]   0.00-120.00 sec  2.21 GBytes   159 Mbits/sec                  sender
[SUM][RX-C]   0.00-120.00 sec  2.19 GBytes   156 Mbits/sec                  receiver
4.2.1.4 Benchmarks - Networking - Test case 1 - CAT6A - packet generation capabilities - M1->R5S
This benchmark was proposed from tkaiser in order to check the packet generation capabilities which would indicate the package processing speed if the device was used as a firewall. You can read more about it here
In the first test the M1 will be the sender
| Host | Command |
|---|---|
| Mac M1 w/ USB-C 2.5G | iperf -s |
| NanoPi R5S (LAN2) | iperf3 -u -c 192.168.2.20 -t 120 -R -O 5 -f m -b 2500M –length {size} |
Notice the
-Rin the client command, which meansreverse, so the M1 will be the sender/client.
This is the table with the results of the various sizes.
| Datagram lenght | Sender bitrate | Sender jitter | Receiver bitrate | Receiver jitter |
|---|---|---|---|---|
| 16 | 20.3 Mbits/sec | 0.000 ms | 12.4 Mbits/sec | 0.013 ms |
| 100 | 125 Mbits/sec | 0.000 ms | 75.9 Mbits/sec | 0.009 ms |
| 300 | 367 Mbits/sec | 0.000 ms | 222 Mbits/sec | 0.007 ms |
| 500 | 626 Mbits/sec | 0.000 ms | 352 Mbits/sec | 0.016 ms |
| 700 | 901 Mbits/sec | 0.000 ms | 512 Mbits/sec | 0.010 ms |
| 900 | 1164 Mbits/sec | 0.000 ms | 653 Mbits/sec | 0.010 ms |
| 1100 | 1405 Mbits/sec | 0.000 ms | 774 Mbits/sec | 0.008 ms |
| 1300 | 1651 Mbits/sec | 0.000 ms | 901 Mbits/sec | 0.007 ms |
| 1472 | 1821 Mbits/sec | 0.000 ms | 1019 Mbits/sec | 0.007 ms |
| 1500 | 1533 Mbits/sec | 0.000 ms | 510 Mbits/sec | 0.016 ms |
The full results from the console output are listed next
Click here to view full console output…
1
2
3
4
5
6
7
8
9
10
11
12
13
14
15
16
17
18
19
20
21
22
23
24
25
26
27
28
29
30
31
32
33
34
35
36
37
38
39
40
41
42
43
44
45
46
47
48
49
50
51
52
53
54
55
56
57
58
59
60
61
62
63
iperf3 -u -c 192.168.2.20 -t 120 -R -O 5 -f m -b 2500M --length 16
[ ID] Interval           Transfer     Bitrate         Jitter    Lost/Total Datagrams
[  5]   0.00-119.99 sec   290 MBytes  20.3 Mbits/sec  0.000 ms  0/19000125 (0%)  sender
[  5]   0.00-120.00 sec   177 MBytes  12.4 Mbits/sec  0.013 ms  7414310/18998651 (39%)  receiver


iperf3 -u -c 192.168.2.20 -t 120 -R -O 5 -f m -b 2500M --length 100
[ ID] Interval           Transfer     Bitrate         Jitter    Lost/Total Datagrams
[  5]   0.00-119.99 sec  1.75 GBytes   125 Mbits/sec  0.000 ms  0/18805217 (0%)  sender
[SUM]  0.0-120.0 sec  15 datagrams received out-of-order
[  5]   0.00-120.00 sec  1.06 GBytes  75.9 Mbits/sec  0.009 ms  7414395/18803684 (39%)  receiver


iperf3 -u -c 192.168.2.20 -t 120 -R -O 5 -f m -b 2500M --length 300
[ ID] Interval           Transfer     Bitrate         Jitter    Lost/Total Datagrams
[  5]   0.00-119.99 sec  5.13 GBytes   367 Mbits/sec  0.000 ms  0/18367841 (0%)  sender
[  5]   0.00-120.00 sec  3.10 GBytes   222 Mbits/sec  0.007 ms  7263672/18366124 (40%)  receiver


iperf3 -u -c 192.168.2.20 -t 120 -O 5 -f m -b 2500M --length 500
[ ID] Interval           Transfer     Bitrate         Jitter    Lost/Total Datagrams
[  5]   0.00-119.99 sec  8.75 GBytes   626 Mbits/sec  0.000 ms  0/18793311 (0%)  sender
[SUM]  0.0-120.0 sec  10 datagrams received out-of-order
[  5]   0.00-120.00 sec  4.92 GBytes   352 Mbits/sec  0.016 ms  8228208/18791810 (44%)  receiver


iperf3 -u -c 192.168.2.20 -t 120 -O 5 -f m -b 2500M --length 700
[ ID] Interval           Transfer     Bitrate         Jitter    Lost/Total Datagrams
[  5]   0.00-120.02 sec  12.6 GBytes   901 Mbits/sec  0.000 ms  0/19321216 (0%)  sender
[  5]   0.00-120.00 sec  7.15 GBytes   512 Mbits/sec  0.010 ms  8348170/19319641 (43%)  receiver


iperf3 -u -c 192.168.2.20 -t 120 -O 5 -f m -b 2500M --length 900
[ ID] Interval           Transfer     Bitrate         Jitter    Lost/Total Datagrams
[  5]   0.00-120.00 sec  16.3 GBytes  1164 Mbits/sec  0.000 ms  0/19398660 (0%)  sender
[  5]   0.00-120.00 sec  9.13 GBytes   653 Mbits/sec  0.010 ms  8507587/19396858 (44%)  receiver


iperf3 -u -c 192.168.2.20 -t 120 -O 5 -f m -b 2500M --length 1100
[ ID] Interval           Transfer     Bitrate         Jitter    Lost/Total Datagrams
[  5]   0.00-120.00 sec  19.6 GBytes  1405 Mbits/sec  0.000 ms  0/19157537 (0%)  sender
[  5]   0.00-120.00 sec  10.8 GBytes   774 Mbits/sec  0.008 ms  8598178/19155709 (45%)  receiver


iperf3 -u -c 192.168.2.20 -t 120 -O 5 -f m -b 2500M --length 1300
[ ID] Interval           Transfer     Bitrate         Jitter    Lost/Total Datagrams
[  5]   0.00-120.00 sec  23.1 GBytes  1651 Mbits/sec  0.000 ms  0/19051115 (0%)  sender
[SUM]  0.0-120.0 sec  15 datagrams received out-of-order
[  5]   0.00-120.00 sec  12.6 GBytes   901 Mbits/sec  0.007 ms  8654520/19049379 (45%)  receiver


iperf3 -u -c 192.168.2.20 -t 120 -O 5 -f m -b 2500M --length 1472
[ ID] Interval           Transfer     Bitrate         Jitter    Lost/Total Datagrams
[  5]   0.00-120.00 sec  25.4 GBytes  1821 Mbits/sec  0.000 ms  0/18554815 (0%)  sender
[SUM]  0.0-120.0 sec  15 datagrams received out-of-order
[  5]   0.00-120.00 sec  14.2 GBytes  1019 Mbits/sec  0.007 ms  8173669/18553316 (44%)  receiver


iperf3 -u -c 192.168.2.20 -t 120 -O 5 -f m -b 2500M --length 1500
[ ID] Interval           Transfer     Bitrate         Jitter    Lost/Total Datagrams
[  5]   0.00-120.03 sec  21.4 GBytes  1533 Mbits/sec  0.000 ms  0/15342241 (0%)  sender
[SUM]  0.0-120.0 sec  5 datagrams received out-of-order
[  5]   0.00-120.00 sec  7.13 GBytes   510 Mbits/sec  0.016 ms  10236599/15338533 (67%)  receiver
4.2.1.4 Benchmarks - Networking - Test case 1 - CAT6A - packet generation capabilities - R5S->M1
Read the test description from above In this test the R5S will be the sender.
| Host | Command |
|---|---|
| Mac M1 w/ USB-C 2.5G | iperf -s |
| NanoPi R5S (LAN2) | iperf3 -u -c 192.168.2.20 -t 120 -O 5 -f m -b 2500M –length {size} |
This is the table with the results of the various sizes.
| Datagram lenght | Sender bitrate | Sender jitter | Receiver bitrate | Receiver jitter |
|---|---|---|---|---|
| 16 | 4.23 Mbits/sec | 0.000 ms | 4.23 Mbits/sec | 0.031 ms |
| 100 | 27.4 Mbits/sec | 0.000 ms | 27.3 Mbits/sec | 0.033 ms |
| 300 | 70.1 Mbits/sec | 0.000 ms | 70.1 Mbits/sec | 0.026 ms |
| 500 | 117 Mbits/sec | 0.000 ms | 117 Mbits/sec | 0.032 ms |
| 700 | 190 Mbits/sec | 0.000 ms | 190 Mbits/sec | 0.032 ms |
| 900 | 243 Mbits/sec | 0.000 ms | 243 Mbits/sec | 0.030 ms |
| 1100 | 254 Mbits/sec | 0.000 ms | 254 Mbits/sec | 0.026 ms |
| 1300 | 349 Mbits/sec | 0.000 ms | 349 Mbits/sec | 0.029 ms |
| 1472 | 395 Mbits/sec | 0.000 ms | 394 Mbits/sec | 0.017 ms |
| 1500 | 321 Mbits/sec | 0.000 ms | 320 Mbits/sec | 0.037 ms |
From the above table and comparing with the previous table where the sender is the M1, it’s obvious that the RK3568 does suffer when it comes to packet generation capabilities. At least compare to the M1 SoC, which is not really a fair comparison.
The full results from the console output are listed next.
Click here to view full console output…
1
2
3
4
5
6
7
8
9
10
11
12
13
14
15
16
17
18
19
20
21
22
23
24
25
26
27
28
29
30
31
32
33
34
35
36
37
38
39
40
41
42
43
44
45
46
47
48
49
50
51
52
iperf3 -u -c 192.168.2.20 -t 120 -O 5 -f m -b 2500M --length 16
[ ID] Interval           Transfer     Bitrate         Jitter    Lost/Total Datagrams
[  5]   0.00-120.00 sec  60.6 MBytes  4.23 Mbits/sec  0.000 ms  0/3970147 (0%)  sender
[  5]   0.00-120.00 sec  60.6 MBytes  4.23 Mbits/sec  0.031 ms  0/3970147 (0%)  receiver

iperf3 -u -c 192.168.2.20 -t 120 -O 5 -f m -b 2500M --length 100
[ ID] Interval           Transfer     Bitrate         Jitter    Lost/Total Datagrams
[  5]   0.00-120.00 sec   392 MBytes  27.4 Mbits/sec  0.000 ms  0/4106500 (0%)  sender
[  5]   0.00-120.00 sec   391 MBytes  27.3 Mbits/sec  0.033 ms  5084/4106500 (0.12%)  receiver


iperf3 -u -c 192.168.2.20 -t 120 -O 5 -f m -b 2500M --length 300
[ ID] Interval           Transfer     Bitrate         Jitter    Lost/Total Datagrams
[  5]   0.00-120.00 sec  1002 MBytes  70.1 Mbits/sec  0.000 ms  0/3503348 (0%)  sender
[  5]   0.00-120.00 sec  1002 MBytes  70.1 Mbits/sec  0.026 ms  0/3503348 (0%)  receiver


iperf3 -u -c 192.168.2.20 -t 120 -O 5 -f m -b 2500M --length 500
[ ID] Interval           Transfer     Bitrate         Jitter    Lost/Total Datagrams
[  5]   0.00-120.00 sec  1.63 GBytes   117 Mbits/sec  0.000 ms  0/3495496 (0%)  sender
[  5]   0.00-120.00 sec  1.63 GBytes   117 Mbits/sec  0.032 ms  0/3495496 (0%)  receiver


iperf3 -u -c 192.168.2.20 -t 120 -O 5 -f m -b 2500M --length 700
[ ID] Interval           Transfer     Bitrate         Jitter    Lost/Total Datagrams
[  5]   0.00-120.00 sec  2.66 GBytes   190 Mbits/sec  0.000 ms  0/4079112 (0%)  sender
[  5]   0.00-120.00 sec  2.66 GBytes   190 Mbits/sec  0.032 ms  0/4079112 (0%)  receiver

iperf3 -u -c 192.168.2.20 -t 120 -O 5 -f m -b 2500M --length 900
[ ID] Interval           Transfer     Bitrate         Jitter    Lost/Total Datagrams
[  5]   0.00-120.00 sec  3.40 GBytes   243 Mbits/sec  0.000 ms  0/4052440 (0%)  sender
[  5]   0.00-120.00 sec  3.40 GBytes   243 Mbits/sec  0.030 ms  0/4052440 (0%)  receiver

iperf3 -u -c 192.168.2.20 -t 120 -O 5 -f m -b 2500M --length 1100
[ ID] Interval           Transfer     Bitrate         Jitter    Lost/Total Datagrams
[  5]   0.00-120.00 sec  3.55 GBytes   254 Mbits/sec  0.000 ms  0/3467852 (0%)  sender
[  5]   0.00-120.00 sec  3.55 GBytes   254 Mbits/sec  0.026 ms  0/3467852 (0%)  receiver

iperf3 -u -c 192.168.2.20 -t 120 -O 5 -f m -b 2500M --length 1300
[ ID] Interval           Transfer     Bitrate         Jitter    Lost/Total Datagrams
[  5]   0.00-120.00 sec  4.88 GBytes   349 Mbits/sec  0.000 ms  0/4031620 (0%)  sender
[  5]   0.00-120.00 sec  4.88 GBytes   349 Mbits/sec  0.029 ms  129/4031619 (0.0032%)  receiver

iperf3 -u -c 192.168.2.20 -t 120 -O 5 -f m -b 2500M --length 1472
[ ID] Interval           Transfer     Bitrate         Jitter    Lost/Total Datagrams
[  5]   0.00-120.00 sec  5.51 GBytes   395 Mbits/sec  0.000 ms  0/4021503 (0%)  sender
[  5]   0.00-120.00 sec  5.51 GBytes   394 Mbits/sec  0.017 ms  3951/4021503 (0.098%)  receiver

iperf3 -u -c 192.168.2.20 -t 120 -O 5 -f m -b 2500M --length 1500
[ ID] Interval           Transfer     Bitrate         Jitter    Lost/Total Datagrams
[  5]   0.00-120.00 sec  4.48 GBytes   321 Mbits/sec  0.000 ms  0/3206860 (0%)  sender
[  5]   0.00-120.00 sec  4.48 GBytes   320 Mbits/sec  0.037 ms  2400/3206860 (0.075%)  receiver
4.2.2 Benchmarks - Networking - Test case 1 - CAT7
This test is performed with a CAT.7 cable of 1m, which is characterized for 500MHz.
4.2.2.1 Benchmarks - Networking - Test case 1 - CAT7 - R5S->M1
The first test is running for 2 mins and with 2 parallel TCP streams
| Host | Command |
|---|---|
| Mac M1 w/ USB-C 2.5G | iperf -s |
| NanoPi R5S (LAN2) | iperf -c 192.168.2.20 -t 120 -d -P 2 |
1
4.2.2.2 Benchmarks - Networking - Test case 1 - CAT7 - M1->R5S
The second test is running for 120 secs, 2x parallel streams and in reverse mode.
Reverse mode means that the Mac M1 with the USB-C dongle will send data to the NanoPi R5S.
| Host | Command |
|---|---|
| Mac M1 w/ USB-C 2.5G | iperf -s |
| NanoPi R5S (LAN2) | iperf3 -c 192.168.2.20 -t 120 -d -P 2 -R |
1
As you can see, the reverse mode is much faster and achieves 2.14 Gbits/sec!
4.2.2.3 Benchmarks - Networking - Test case 1 - CAT7 - R5S<->M1
The second test is running for 120 secs, 2x parallel streams and in bidirectional mode.
Bidirectional mode means that the Mac M1 with the USB-C dongle will send data to the NanoPi R5S and then the opposite in full-duplex mode. This is the worst of the worsts case scenario you can get.
| Host | Command |
|---|---|
| Mac M1 w/ USB-C 2.5G | iperf -s |
| NanoPi R5S (LAN2) | iperf3 -c 192.168.2.20 -t 120 -d -P 2 –bidir |
1
4.2.3 Benchmarks - Networking - Test case 2
This will be done when I have a second adapter.
4.2.4 Benchmarks - Networking - Test case 3
This will be done when I have a second adapter.
5. Conclusions
Well, personally I’m excited with the NanoPi-R5S. This is what you get for $60 today (+$16 for the case). 2x 2.5Gbps ports and a Quad core running all cores at 2GHz. For me, this makes a great router if you want to upgrade to 2.5G. Also the fact that it comes with an OS that you can do pretty much whatever you like it’s also nice. You can even use the nvme M.2 slot to install an SSD and use it as your local network storage.
Also, FriendlyWRT it’s not the only OS you can get. You can choose also between Android and Ubuntu and a docker ready image. This means that you can use the NanoPi-R5S for many different use-cases. For example, it could also serve as a k3s node (I suggeset the 4GB RAM for that). There are really so much things that you can do. Especially, since I’m running my own K3S cluster with 1x Jetson nano as the master and 3x RPi-8GB nodes, the NanoPi-R5S really rings a bell to me that it would be a great K3S node.
My personal opinion, according to my current testsm is that this is the best SBC from FriendlyElec so far. The performance/price ratio is great, especially considering the high prices of other alternatives right now and the lack of SBC in the market because of the COVID.
Unfortunately, I need to leave for a couple of months and therefore I won’t be able to play around more with the NanoPi-R5S, but when I’m back I would like to test it also in a K3S cluster. I mean for the price is a no brainer. You can build a 2.5G K3S cluster at your home. Just wow…
I’ll be back with more tests in the future.
Have fun!
Comments powered by Disqus.