Intro
Note: This is a series of posts on using the ELK on embedded. Here you can find part1.
In the previous post on the ELK on Embedded I’ve demonstrated the most simple example you can use. I’ve set up an Elasticsearch and a Kibana server using docker on my workstation and then I’ve use this meta layer on a custom Yocto image on the nanopi-k1-plus to build the official metricbeat and test it. This was a really simple example but at the same time is very useful because you can use the Yocto layer to build beats for your custom image and any ARM architecture using the Yocto toolchain.
On this post things will get a bit more complicated, but at the same time I’ll demonstrate a full custom solution to use ELK on your custom hardware and with your custom beat. For this post, I’ve chosen the STM32MP157C dev kit, which I’ve presented here and here. This will make things even more complicated and I’ll explain later why. So, let’s have a look at the demo system architecture.
System Architecture
The following block diagram shows this project’s architecture.

As you can see from the above diagram, most of the things remain the same with part-1 and the only thing that changes is the client. Also the extra complexity is on that client. So let’s see what the client does exactly.
The STM32MP1 SoC integrates a Cortex-M4 (CM4) and a Cortex-A7 (CA7) on the same SoC and both have access to the same peripherals and address space. In this project I’m using 4x ADC channels which are available on the bottom Arduino connector of the board. The channels I’m using are A0, A1, A2 and A3. I’m also using a DMA stream to copy the ADC samples on the memory with double buffering. Finally the ADC peripheral is triggered by a timer. The sampled values then are sent to the CA7 using the OpenAMP IPC. Therefore, as you can see the firmware is already complex enough.
At the same time the CA7 CPU is running a custom Yocto Linux image. On the user space, I’ve developed a custom elastic beat that reads the ADC data from the OpenAMP tty port and then publishes the data to a remote Elasticsearch server. Finally, I’m using a custom Kibana dashboard to monitor the ADC values using a standalone X96mini.
As you can see the main complexity is mostly on the client, which is the common case scenario that you going to deal with in embedded. Next I’ll explain all the steps needed to achieve this.
Setting up an Elasticsearch and Kibana server
This step has been explained on the previous post, with enough detail, therefore I’ll save some space and time. You can read on how to set it up here. You can use the part-2 folder of the repo, though, but be aware it’s almost the same. The only thing I’ve changed is the versions for Elasticsearch and Kibana.
Proceed with the guide on the previous post, until the point that you verify that the server status is OK.
1
http://localhost:5601/status
The above command is when checking the status from the server and you need to use the server’s IP when checking from the web client (X96mini in this case).
Cortex-CM4 firmware
So, let’s have a look at the firmware of the CM4. You can find the firmware here:
https://gitlab.com/dimtass/stm32mp1-rpmsg-adcsampler https://github.com/dimtass/stm32mp1-rpmsg-adcsampler https://bitbucket.org/dimtass/stm32mp1-rpmsg-adcsampler
In the repo’s README file you can read more information on how to build the firmware, but since I’m using Yocto I won’t get into those details. The important files of the firmware are the source/src_hal/main.c and source/src_hal/stm32mp1xx_hal_msp.c. Also in main.h you’ll find the main structures I’m using for the ADCs.
1
2
3
4
5
6
7
8
9
10
11
12
13
14
15
16
17
18
19
20
21
22
23
24
25
26
27
28
enum en_adc_channel {
  ADC_CH_AC,
  ADC_CH_CT1,
  ADC_CH_CT2,
  ADC_CH_CT3,
  ADC_CH_NUM
};

#define NUMBER_OF_ADCS 2

struct adc_dev_t {
  ADC_TypeDef         *adc;
  uint8_t             adc_irqn;
  void (*adc_irq_handler)(void);
  DMA_Stream_TypeDef  *dma_stream;
  uint8_t             dma_stream_irqn;
  void (*stream_irq_handler)(void);
};

struct adc_channel_t {
  ADC_TypeDef         *adc;
  uint32_t            channel;
  GPIO_TypeDef        *port;
  uint16_t            pin;
};

extern struct adc_channel_t adc_channels[ADC_CH_NUM];
extern struct adc_dev_t adc_dev[NUMBER_OF_ADCS];
The adc_dev_t struct contains the details for the ADC peripheral which is this case is the ADC2 and the adc_channel_t contains the channel configuration. As you can see both are declares as arrays, because the CM4 has 2x ADCs and I’m also using 4x channels for the ADC2. Both structs are initialized in the main.c
1
2
3
4
5
6
7
8
9
10
11
12
13
14
15
16
17
18
19
20
21
22
23
24
25
26
27
28
29
30
31
32
33
34
35
36
37
38
39
40
41
42
43
44
45
46
47
48
49
50
uint16_t adc1_values[ADC1_BUFFER_SIZE];  // 2 channels on ADC1
uint16_t adc2_values[ADC2_BUFFER_SIZE];  // 3 channels on ADC2


struct adc_channel_t adc_channels[ADC_CH_NUM] = {
  [ADC_CH_AC] = {
    .adc = ADC2,
    .channel = ADC_CHANNEL_6,
    .port = GPIOF,
    .pin = GPIO_PIN_14,
  },
  [ADC_CH_CT1] = {
    .adc = ADC2,
    .channel = ADC_CHANNEL_2,
    .port = GPIOF,
    .pin = GPIO_PIN_13,
  },
  [ADC_CH_CT2] = {
    .adc = ADC2,
    .channel = ADC_CHANNEL_0,
    .port = GPIOA,
    .pin = GPIO_PIN_0,
  },
  [ADC_CH_CT3] = {
    .adc = ADC2,
    .channel = ADC_CHANNEL_1,
    .port = GPIOA,
    .pin = GPIO_PIN_1,
  },
};


struct adc_dev_t adc_dev[NUMBER_OF_ADCS] = {
  [0] = {
    .adc = ADC2,
    .adc_irqn = ADC2_IRQn,
    .adc_irq_handler = &ADC2_IRQHandler,
    .dma_stream = DMA2_Stream1,
    .dma_stream_irqn = DMA2_Stream1_IRQn,
    .stream_irq_handler = &DMA2_Stream1_IRQHandler,
  },
  [1] = {
    .adc = ADC1,
    .adc_irqn = ADC1_IRQn,
    .adc_irq_handler = &ADC1_IRQHandler,
    .dma_stream = DMA2_Stream2,
    .dma_stream_irqn = DMA2_Stream2_IRQn,
    .stream_irq_handler = &DMA2_Stream2_IRQHandler,
  },
};
I find the above way the easiest and more descriptive to initialize such structures in C. I’m using those structs in the rest of the code in the various functions and because those structs are generic is easy to handle with pointers.
In case of STM32MP1 you need to be aware that the pin-mux for both CA7 and CM4 is configured by using the device tree. Therefore, the configuration is done when the kernel boots and furthermore you need to plan which pin is used by each processor. Also, in order to be able to run this firmware you need to enable the PMIC access from the CM4, but I’ll get back to that later when I’ll describe how to use the Yocto image.
Next important part of the firmware is the Timer, ADC and DMA configuration, which is done in source/src_hal/stm32mp1xx_hal_msp.c. The timer is initialized in HAL_TIM_Base_MspInit() and MX_TIM2_Init(). The timer is only used to trigger the ADC on a constant period and every time the timer is expired, it triggers an ADC conversion and then reloads.
The ADC is initialized and configured in HAL_ADC_MspInit and Configure_ADC() functions. The DMA_Init_Channel() is called for every channel. Finally, the interrupts from the ADC/DMA are handled in HAL_ADC_ConvHalfCpltCallback() and HAL_ADC_ConvCpltCallback(). The reason there are two interrupts is that I’m using double buffering and each interrupt fills one half of the buffer, therefore the first interrupt fills the first half and the second interrupt fills the second half of the buffer. This means that there is enough time between the same interrupt triggers again to fill another buffer with the results and send the buffer on the CA7 using OpenAMP.
You need to be aware though, that the OpenAMP is a slow IPC which is meant for control and not for exchanging fast or big data. Therefore, you need to have a quite slow timer that triggers the ADC conversions, otherwise the interrupts will be faster that the OpenAMP. To solve this you can use a larger buffer pool that sends the data async in the main loop, rather inside the interrupt. In this case though, I’m just sending the ADC values inside the interrupt using a slow timer for simplicity. Also there’s no reason to flood the Elasticsearch server with ADC data.
There’s also a smarter way to handle the ADC values flow rate from the STM32MP1 to the Elasticserver. You can have a tick timer that sends ADC values at constant times which are not that frequent and if you want to be able to catch important changes in the values then you can have an algorithmic filter that buffers those important changes that are outside of configurable limits and then report only those values to the server. You can also use average values is it’s applicable for your case.
Finally, this is the part where the CM4 firmware transmits the ADC values in a string format to the CA7
1
2
3
4
5
6
7
8
9
10
11
12
13
14
15
16
17
18
19
20
21
22
23
24
25
26
27
void HAL_ADC_ConvCpltCallback(ADC_HandleTypeDef *hadc)
{

  /* Update status variable of DMA transfer */
  ubDmaTransferStatus = 1;

  /* Set LED depending on DMA transfer status */
  /* - Turn-on if DMA transfer is completed */
  /* - Turn-off if DMA transfer is not completed */
  BSP_LED_On(LED7);

  if (hadc->Instance == ADC1) {
    sprintf((char*)virt_uart0.tx_buffer, "ADC[1.2]:%d,%d,%d,%d\n",
      adc2_values[0], adc2_values[1], adc2_values[2], adc2_values[3]);
    printf((char*)virt_uart0.tx_buffer);
  }
  else if (hadc->Instance == ADC2) {
    sprintf((char*)virt_uart0.tx_buffer, "ADC[2.2]:%d,%d,%d,%d\n",
      adc2_values[0], adc2_values[1], adc2_values[2], adc2_values[3]);
    printf((char*)virt_uart0.tx_buffer);
  }

  virt_uart0.rx_size = 0;
  virt_uart0_expected_nbytes = 0;
  virt_uart0.tx_size = strlen((char*)virt_uart0.tx_buffer);
  virt_uart0.tx_status = SET;
}
As you can see the format looks like this:
1
ADC[x,y]:<ADC1>,<ADC2>,<ADC3>,<ADC4>\n
where:
x, is the the ADC peripheral [1 or 2]y, is the double-buffer index, 10: first half, 2: second half<ADCz>, is the 12-bit value of the ADC sample
adcsamplerbeat
Now that we have the CM4 firmware the next thing we need is the elastic beat client that sends the ADC sample values to the Elasticsearch server. Since this is a custom application there’s no any beat available that meets our needs, therefore we need to need to create our own! To do this it’s actually quite easy, all you need is to use the tool that comes with the elastic beats repo. There’s also a guide on how to create a new beat here.
My custom beat repo for this post is this one here:
https://github.com/dimtass/adcsamplerbeat
Note: This guide is for v7.9.x-v8.0.x and it might be different in other versions!
First you need to setup your Golang environment.
1
2
3
4
5
6
export GOPATH=/home/$USER/go
cd /home/$USER/go
mkdir -p src/github.com/elastic
cd src/github.com/elastic
git clone https://github.com/elastic/beats.git
cd beats
Now that you’re in the beats directory you need to run the following command in order to create a new beat
1
mage GenerateCustomBeat
This will start an interactive process that you need to fill some details about your custom beat. The following are the ones that I’ve used, but you need to use your own personal data.
1
2
3
4
5
6
Enter the beat name [examplebeat]: adcsamplerbeat
Enter your github name [your-github-name]: dimtass
Enter the beat path [github.com/dimtass/adcsamplerbeat]:
Enter your full name [Firstname Lastname]: Dimitris Tassopoulos
Enter the beat type [beat]:
Enter the github.com/elastic/beats revision [master]:
After the script is done the tool is already created a new folder with your custom beat, so go in there and have a look.
1
cd $GOPATH/src/github.com/dimtass/adcsamplerbeat
As you can see there are too many things already in the folder, but don’t worry not all of them are important to us. Actually, there are only 3 important files. Let’s have a look in the configuration file first, which is located in config/config.go. In this file you need to add our custom configuration variables. In this case I need this go beat to be able to open a Linux tty port and retrieve data, therefore I need a serial go module. I’ve used the tarm/serial module which you can find here.
So, to open a serial port I need the device path in the filesystem, the baudrate and the read timeout. Of course you could add more configuration like parity, bit size and stop bits, but in this case that’s not important as it’s not a generic beat and the serial port configuration is static. Therefore, to add the needed configuration parameters in the the config/config.go I’ve edited the file and add this paramters:
1
2
3
4
5
6
7
8
9
10
11
12
13
type Config struct {
    Period 			time.Duration `config:"period"`
    SerialPort		string	`config:"serial_port"`
    SerialBaud		int		`config:"serial_baud"`
    SerialTimeout	time.Duration	`config:"serial_timeout"`
}

var DefaultConfig = Config{
    Period: 1 * time.Second,
    SerialPort: "/dev/ttyUSB0",
    SerialBaud: 115200,
    SerialTimeout: 50,
}
As you can see there’s a default config struct, which contains the default values, but you can override those values using the the yaml configuration file as I’ll explain in a bit. Now that you’ve edited this file you need to run a command that creates all the necessary code based on this configuration. To do so, run this:
1
make update
The next important file is where the magic happens and that’s the beater/adcsamplerbeat.go file. In there it’s the main code of the beat, so you can add you custom functionality in there. You can have a look in detail in the file here, but the interesting code is that one:
1
2
3
4
5
6
7
8
9
10
11
12
13
14
15
16
17
18
19
20
21
22
23
24
25
26
27
28
29
30
31
32
33
34
35
36
37
38
39
40
41
42
43
44
    ticker := time.NewTicker(bt.config.Period)
    counter := 1
    for {
        select {
        case <-bt.done:
            return nil
        case <-ticker.C:
        }

        buf := make([]byte, 512)

        n, _ = port.Read(buf)
        s := string(buf[:n])
        s1 := strings.Split(s,"\n")	// split new lines
        if len(s1) > 2 && len(s1[1]) > 16 {
            fmt.Println("s1: ", s1[1])
            s2 := strings.SplitAfterN(s1[1], ":", 2)
            fmt.Println("s2: ", s2[1])
            s3 := strings.Split(s2[1], ",")
            fmt.Println("adc1_val: ", s3[0])
            fmt.Println("adc2_val: ", s3[1])
            fmt.Println("adc3_val: ", s3[2])
            fmt.Println("adc4_val: ", s3[3])
            adc1_val, _ := strconv.ParseFloat(s3[0], 32)
            adc2_val, _ := strconv.ParseFloat(s3[1], 32)
            adc3_val, _ := strconv.ParseFloat(s3[2], 32)
            adc4_val, _ := strconv.ParseFloat(s3[3], 32)

            event := beat.Event {
                Timestamp: time.Now(),
                Fields: common.MapStr{
                    "type":    b.Info.Name,
                    "counter": counter,
                    "adc1_val": adc1_val,
                    "adc2_val": adc2_val,
                    "adc3_val": adc3_val,
                    "adc4_val": adc4_val,
                },
            }
            bt.client.Publish(event)
            logp.Info("Event sent")
            counter++
        }
    }
Before this code, I’m just opening the tty port and send some dummy data to trigger the port and then everything happens in the above loop. In this loop the serial module reads data from the serial port and then parses the interesting information, which are the ADC sample values and constructs a beat event. Finally it publishes the event at the Elasticserver.
In this case I’m using a small trick. Since the data that are coming from the serial port are quite fast, the serial read buffer usually contains 3 or 4 samples and maybe more. For that reason I’m always parsing the second one (index 1) and the reason for that is to avoid having to deal with more complex buffer parsing, because there might be a case that the begin and the end of the buffer are not complete. That way I’m just using a newline split and remove the first and the last strings that may incomplete. Because this is a trick, you might prefer to a better implementation but in this case I just need a fast prototype.
Finally, the last important file is the configuration yaml file, which in this case is the adcsamplerbeat.yml. This file contains the configuration that overrides the default values and also contains the generic configuration of the beat which means that you need to configure the IP of the remote Elasticsearch server as also any other configuration that is available for the beat, e.g. authentication e.t.c. Be aware that the period parameter in the yml file refers to how often the beat client connect to the server to publish its data. This means that if the beat client collects 12 events per second then it will connect only once per second and publish that data.
For now this configuration file is not that important because I’m going to use Yocto that will override the whole yaml file using the package recipe.
Building the Yocto image
Using Yocto is the key of this demonstration and the reason for this is that by using a Yocto recipe you can build any elastic beat for your specific architecture. For example even for the official beats there are only aarch64 pre-built binaries and there aren’t any armhf or armel, but in this case the STM32MP1 is an armhf CPU, therefore it wouldn’t possible even to find binaries for this CPU. Therefore Yocto comes handy and we can use its superpowers to build also our custom beat.
For the STM32MP1 I’ve created a BSP base layer that simplifies a lot the Yocto development and you can find it here:
- https://gitlab.com/dimtass/meta-stm32mp1-bsp-base
- https://github.com/dimtass/meta-stm32mp1-bsp-base
- https://bitbucket.org/dimtass/meta-stm32mp1-bsp-base
I’ve written thorough details on how to use it and be able to build an image in the repo README file, therefore I’ll skip this step and focus on the important stuff. First you need to build the stm32mp1-qt-eglfs-image image (well you could also build another, but this is what I did for also other reason which are irrelevant to the post). Then you need to flash the image on the STM32MP1. I didn’t add the firmware and the adcsamplerbeat recipes in the image, but instead I’ve just built the recipes and the scp the deb files in the target and install them using dpkg, which works just fine for developing and testing.
The firmware for the CM4 is already included in the meta-stm32mp1-bsp-base repo and the recipe is the meta-stm32mp1-bsp-base/recipes-extended/stm32mp1-rpmsg-adcsampler/stm32mp1-rpmsg-adcsampler_git.bb.
But you need to add the adcsampler recipe yourself. For that reason I’ve created another meta recipe layer which is this one:
- https://gitlab.com/dimtass/meta-adcsamplebeat
- https://github.com/dimtass/meta-adcsamplebeat
- https://bitbucket.org/dimtass/meta-adcsamplebeat
To use this recipe you need to add it your sources folder and then also add it in the bblayers. First clone the repo in the sources folder.
1
2
cd sources
git clone https://gitlab.com/dimtass/meta-adcsamplebeat.git
Then in the build folder that you’ve run the setup-environment.sh script as explained in my BSP base repo, run this command
1
bitbake-layers add-layer ../sources/meta-adcsamplebeat
Now you should be able to build the adcsamplerbeat for the STM32MP1 with this command
1
bitbake adcsamplerbea
After the build finishes the deb file should be in build/tmp-glibc/deploy/deb/cortexa7t2hf-neon-vfpv4/adcsamplerbeat_git-r0_armhf.deb.
That’s it! Now you should have all that you need. So first boot the STM32MP1 and then scp the deb file from your host builder and install it on the target like that
1
2
3
4
5
6
# Yocto builder
scp /path/to/yocto/build/tmp-glibc/deploy/deb/cortexa7t2hf-neon-vfpv4/adcsamplerbeat_git-r0_armhf.deb root@<stm32mp1ip>:/home/root

# On the STM32MP1
cd /home/root
dpkg -i adcsamplerbeat_git-r0_armhf.deb
Of course you need to do the same procedure for the CM4 firmware, meaning that you need to build it using bitbake
1
bitbake stm32mp1-rpmsg-adcsampler
And then scp the deb from build/tmp-glibc/deploy/deb/cortexa7t2hf-neon-vfpv4/stm32mp1-rpmsg-adcsampler_git-r0_armhf.deb to the STM32MP1 target and install it using dpkg.
Finally, you need to verify that everything is installed. To do that have a look in the following path and verify that the files exists
1
2
3
4
/usr/bin/fw_cortex_m4.sh
/lib/firmware/stm32mp157c-rpmsg-adcsampler.elf
/usr/bin/adcsamplerbeat
/usr/share/adcsamplerbeat/adcsamplerbeat
If the above files exists then probably everything is set up correctly.
Last thing is that you need to load the proper device tree otherwise the ADCs won’t work. To do that edit the /boot/extlinux/extlinux.conf file on the board and set the default boot mode to stm32mp157c-dk2-m4-examples like this
1
DEFAULT stm32mp157c-dk2-m4-examples
This mode will use the /stm32mp157c-dk2-m4-examples.dtb device tree file which let’s the CM4 to enable the ADC ldos using the PMIC.
Testing the adcsamplerbeat
Finally, it’s time for some fun. Now everything should be ready on the STM32MP1 and also the Elasticsearch and Kibana servers should be up and running. First thing you need to do is to execute the CM4 firmware. To do that run this command on the STM32MP1 target
1
fw_cortex_m4.sh start
This command will load the stm32mp157c-rpmsg-adcsampler.elf from the /lib/firmware on the CM4 and execute it. When this is done, then the CM4 will start sampling the four ADC channels and send the results on the Linux user-space using OpenAMP.
Next, you need to run the adcsamplerbeat on the STM32MP1, but before you do that verify that the /etc/adcsamplerbeat/adcsamplerbeat.yml file contains the correct configuration for the tty port and the remote Elasticsearch server. Also make sure that both the SBC and the server are on the same network. The run this command:
1
adcsamplerbeat
You should see an output like that
1
2
3
4
5
6
7
8
root:~# adcsamplerbeat
Opening serial: %s,%d /dev/ttyRPMSG0 115200
s1:  ADC[2.2]:4042,3350,4034,4034
s2:  4042,3350,4034,4034
adc1_val:  4042
adc2_val:  3350
adc3_val:  4034
adc4_val:  4034
This means that the custom beat is working fine on the armhf CPU! Nice.
Now you need to verify that also the Elastic server gets the data from the beat. To do that open a browser (I’m using the X96mini as a remote Kibana client) and type the Kibana url. Wait for the UI to load and then using your mouse and starting from the left menu browse to the this path
Management -> Stack Management -> Kibana -> Index Patterns -> Create index pattern
Then you should see this

If you already see those sources that you can select from in your results, then it means that it’s working. So no you need to type adcsamplerbeat-* in the index pattern name like this:
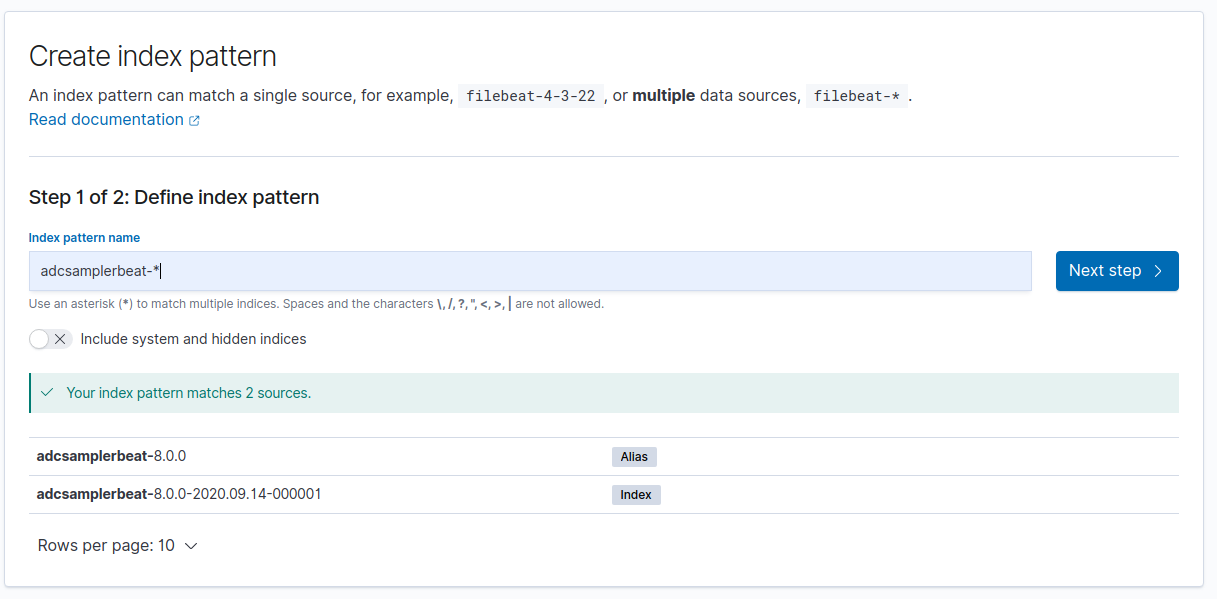
Finally, after applying and getting to the next step you should see something similar to this
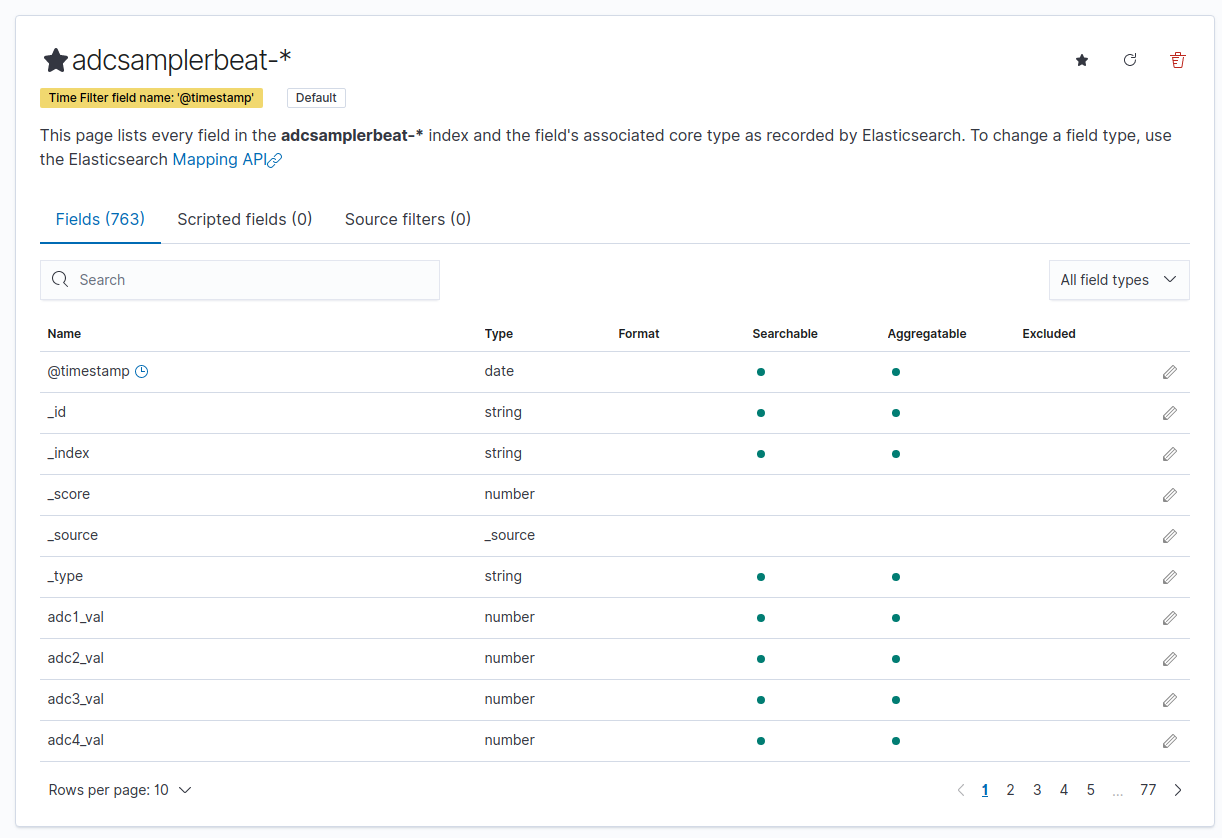
As you can see from the above image these are the data that are transmitted from the target to the server. In my case I’ve commented out these processors in my adcsamplerbeat.yml file
1
2
3
4
processors:
  - add_host_metadata: ~
  # - add_cloud_metadata: ~
  # - add_docker_metadata: ~
I suggest you do the same to minimize the data transmitted over the network. You could also comment out the host, but this would make it difficult then to trace which data from the database are belonging to a host if many exist.
Now we need to setup a dashboard to be able to visualize these data.
Setting up a custom Kibana dashboard
Kibana is very flexible and a great tool to create custom dashboards. To create a new dashboard to display the ADC sample data you need to use your mouse and starting from the left menu browse to
Dashboard -> Create new dashboard
You should see this
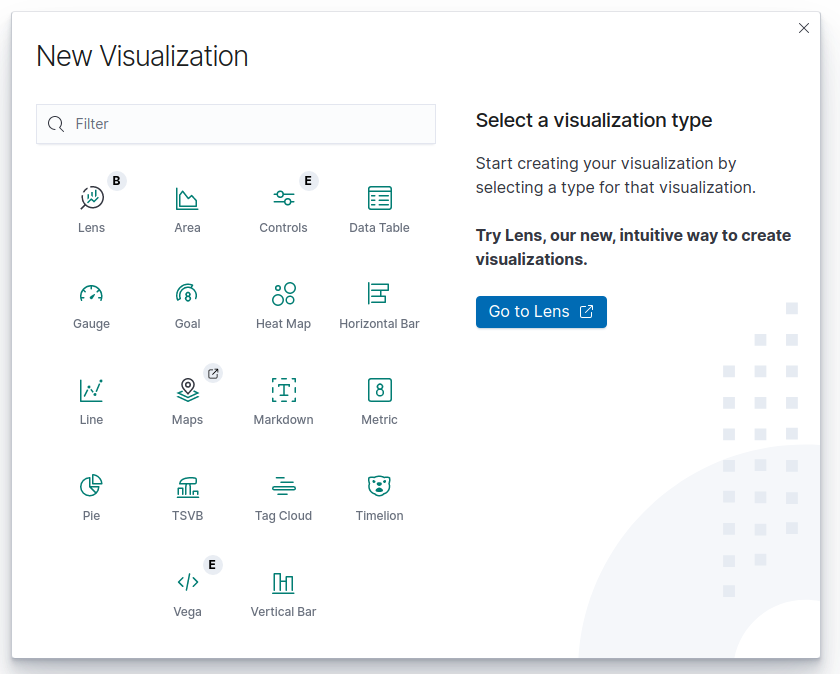
Now select the Line visualization and then you get the next screen
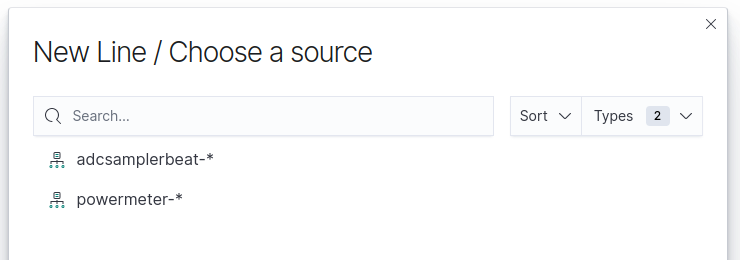
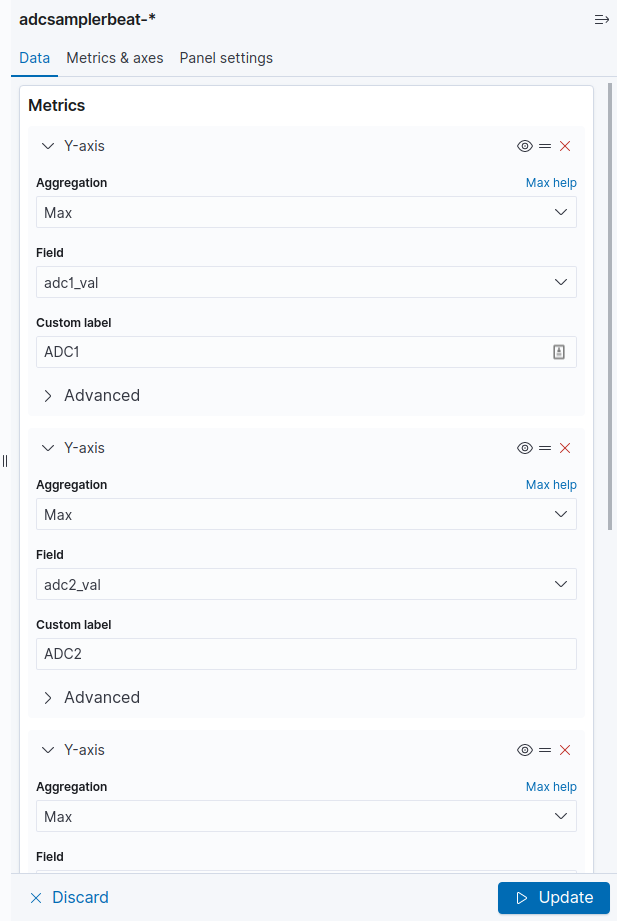
Ignore any other indexes and just select adcsamplerbeat-* then in the next screen you need to add a Y-axis for every ADC value and also use the following configuration for each axis
1
2
3
Aggregation: Max
Field: adcX_val
Custon label: ADCx
Instead of X, x use the ADC index (e.g. adc1_val and ADC1 e.t.c.)
Finally you need to add a bucket. Bucket is actually the X axis and in there all you need is to configure it like that
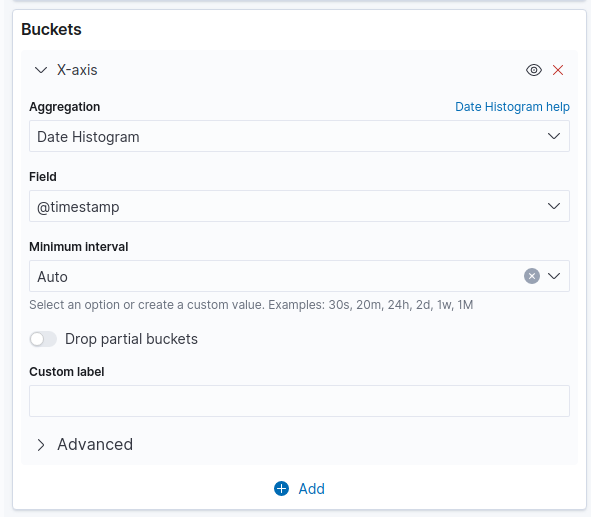
When you apply all changes you should see something similar to this
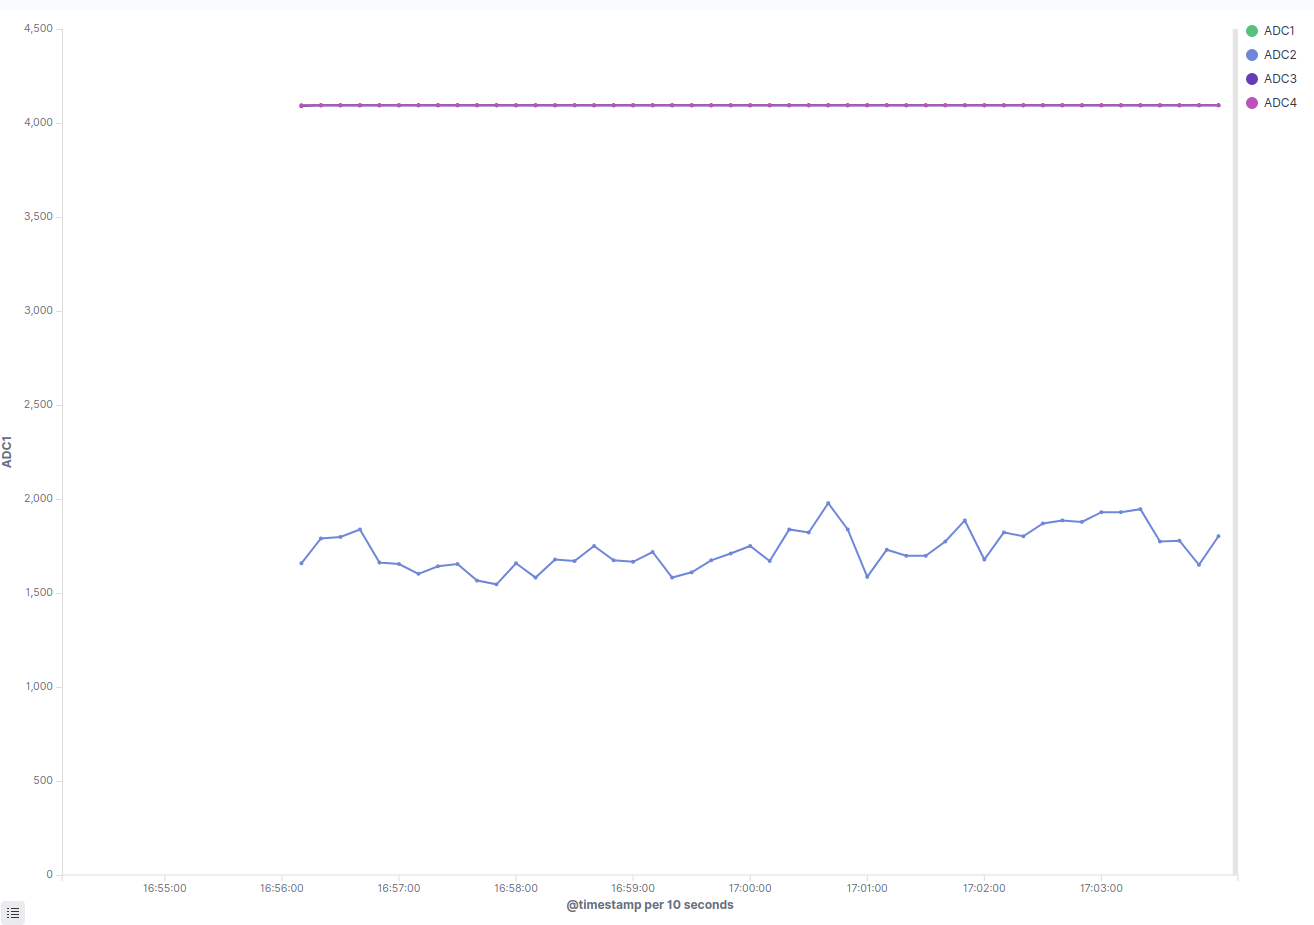
In the above plot there are 4x ADCs but the 3 of them are floating and the value is close to the max ADC range value which is 4092 (for 12-bits).
That’s it! You’re done. Now you have your STM32MP1 sampling 4x ADC and publish the samples on an Elasticserver and then you can use Kibana to visualize the data on a custom dashboard.
Conclusions
So, that was a quite long post, but it was interesting to implement a close-to-real-case-scenario project using ELK for an embedded device. In this example I’ve used Yocto to build the Linux image for the STM32MP1 and also the firmware for the CM4 MCU and also the go beat module.
I’ve used the CM4 to sample 4x ADC channels using DMA and double buffering and then OpenAMP to send the buffers from the CM4 to the CA7 and the Linux user-space. Then the custom adcsamplerbeat elastic beat module published the ADC sampling data to the Elasticsearch server and finally I’ve used the Kibana web interface to create a dashboard and visualize the data.
This project might be a bit complex because of the STM32MP1, but other than that it’s quite simple. Nevertheless, it’s a fine example on how you can use all those interesting technologies together and build a project like that. The STM32MP157C is an interesting SBC to use in this case because you can connect whatever sensors you like on the various peripherals and then create a custom beat to publish the data.
By using this project as a template you can create very complex setups, with whatever data you like and create your custom filters and dashboards to monitor your data. If you use something like this, then share your experience in the comments.
Have fun!